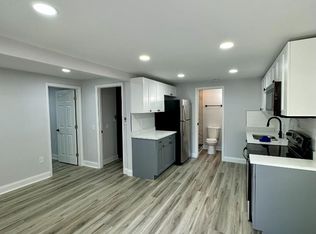
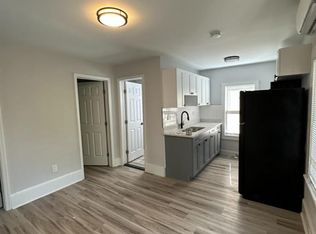
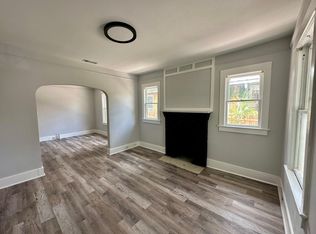
Income-producing opportunity in Southeast Seminole Heights! This versatile property offers three separate living spaces across two buildings and generated $57,600 in gross rental income in 2025, according to the seller. The main residence features generously sized bedrooms and distinctive architectural character, including arched openings, a living-room fireplace, and a covered front porch. Its flexible layout can function as a 3-bedroom, 1-bathroom home or as a 2-bedroom residence with a dedicated office, den, or flex room. Estimated market rent is approximately $1,900-$2,000 per month. The detached two-story accessory building contains two updated residences. The downstairs 2-bedroom, 1-bathroom unit is estimated to rent for approximately $1,350 per month, while the upstairs 3-bedroom, 1-bathroom unit is estimated at approximately $1,550 per month. The rear building offers separate access, parking, and convenient entry from the back alley, providing additional privacy and independence from the main residence. Combined estimated rents total $4,800 per month, or $57,600 annually in potential gross rental income. The flexible configuration makes this an attractive option for a full investment property, multigenerational living, or an owner-occupant seeking to offset housing expenses with rental income. The detached ADU building is leased through August 29, 2027 (Unit #B) and Unit #C is leased through September 30, 2027. Located approximately 3 miles from Downtown Tampa and minutes from I-275, with convenient access to Armature Works, Ybor City, Busch Gardens, USF, dining, entertainment, and major employment centers. No HOA. Buyer to verify zoning, permitted use, room dimensions, rental information, and all details material to the buyer’s intended use.
For sale
$599,000
1021 E CAYUGA STREET, TAMPA, FL 33603
8beds
2,532sqft
Single Family Residence
Built in 1926
6,960 Square Feet Lot
$-- Zestimate®
$237/sqft
$-- HOA
What's special
Detached two-story accessory buildingUpdated residencesCovered front porchDistinctive architectural characterLiving-room fireplaceArched openings
- 28 days
- 517
- 45
Zillow last checked:
Listing updated:
Listed by:
Sean Sandifer 217-343-7365,
KELLER WILLIAMS ST PETE REALTY 727-894-1600,
Anton Kozub 727-900-2173,
KELLER WILLIAMS ST PETE REALTY
Source: Stellar MLS,MLS#: TB8556867 Originating MLS: Suncoast Tampa
Facts & features
Interior
Bedrooms & bathrooms
- Bedrooms: 8
- Bathrooms: 3
- Full bathrooms: 3
Primary bedroom
- Features: Built-in Closet
- Level: First
Primary bathroom
- Level: First
Kitchen
- Level: First
Living room
- Level: First
Heating
- Central, Electric
Cooling
- Central Air, Ductless
Appliances
- Included: Range, Refrigerator
- Laundry: Laundry Closet
Features
- High Ceilings
- Flooring: Carpet, Tile
- Has fireplace: Yes
- Fireplace features: Living Room
Interior area
- Total structure area: 2,756
- Total interior livable area: 2,532 sqft
Video & virtual tour
Property
Parking
- Parking features: Common, Driveway, On Street, Open, Oversized
- Has uncovered spaces: Yes
Features
- Levels: One
- Stories: 1
- Exterior features: Lighting
Lot
- Size: 6,960 Square Feet
- Dimensions: 48 x 145
Details
- Parcel number: A0629194LG00000000003.0
- Zoning: SH-RS
- Special conditions: None
Construction
Type & style
- Home type: SingleFamily
- Property subtype: Single Family Residence
Materials
- Wood Frame
- Foundation: Crawlspace
- Roof: Shingle
Condition
- Fixer
- New construction: No
- Year built: 1926
Utilities & green energy
- Sewer: Public Sewer
- Water: Public
- Utilities for property: Cable Available, Electricity Available, Water Available, Water Connected
Community & HOA
Community
- Pet fee: $0 monthly
- Subdivision: PHILLIP SUB
HOA
- Has HOA: No
Location
- Region: Tampa
Financial & listing details
- Price per square foot: $237/sqft
- Tax assessed value: $258,141
- Annual tax amount: $5,087
- Date on market: 10/9/2026
- Cumulative days on market: 28 days
- Listing terms: Cash,Conventional,FHA,VA Loan
- Ownership: Fee Simple
- Total actual rent: 18600
- Electric utility on property: Yes
- Road surface type: Paved
Foreclosure details
Estimated market value
Not available
Estimated sales range
Not available
$3,847/mo
Price history
| Date | Event | Price |
|---|---|---|
| 10/9/2026 | Listed for sale | $599,000-24.1%$237/sqft |
Source:  Stellar MLS #TB8556500 Report a problem | ||
| 12/1/2025 | Listing removed | $789,000$312/sqft |
Source: Stellar MLS #TB8391663 Report a problem | ||
| 8/8/2025 | Price change | $789,000-1.3%$312/sqft |
Source: Stellar MLS #TB8391663 Report a problem | ||
| 6/3/2025 | Listed for sale | $799,000+142.1%$316/sqft |
Source: Stellar MLS #TB8391663 Report a problem | ||
| 2/26/2024 | Listing removed | -- |
Source: Zillow Rentals Report a problem | ||
| 1/21/2024 | Listed for rent | $1,700$1/sqft |
Source: Zillow Rentals Report a problem | ||
| 1/12/2024 | Listing removed | -- |
Source: Zillow Rentals Report a problem | ||
| 12/4/2023 | Listed for rent | $1,700$1/sqft |
Source: Zillow Rentals Report a problem | ||
| 11/19/2023 | Listing removed | -- |
Source: Zillow Rentals Report a problem | ||
| 9/25/2023 | Listed for rent | $1,700$1/sqft |
Source: Zillow Rentals Report a problem | ||
| 11/17/2022 | Sold | $330,000-13.2%$130/sqft |
Source: Public Record Report a problem | ||
| 9/22/2022 | Pending sale | $380,000$150/sqft |
Source: Stellar MLS #T3394922 Report a problem | ||
| 9/13/2022 | Listed for sale | $380,000$150/sqft |
Source: Stellar MLS #T3394922 Report a problem | ||
| 9/8/2022 | Pending sale | $380,000$150/sqft |
Source: Stellar MLS #T3394922 Report a problem | ||
| 8/11/2022 | Listed for sale | $380,000+90.1%$150/sqft |
Source: Stellar MLS #T3394922 Report a problem | ||
| 2/14/2008 | Listing removed | $199,900$79/sqft |
Source: eWebEngine #t2253494 Report a problem | ||
| 11/16/2007 | Price change | $199,900+91178.5%$79/sqft |
Source: eWebEngine #t2253494 Report a problem | ||
| 5/27/2007 | Listed for sale | $219 |
Source: Owner Report a problem | ||
Public tax history
| Year | Property taxes | Tax assessment |
|---|---|---|
| 2025 | $5,294 +4.1% | $258,141 |
| 2024 | $5,088 +3.2% | $258,141 +4.1% |
| 2023 | $4,932 +552.5% | $247,961 +262.1% |
| 2022 | $756 -0.7% | $68,486 +3% |
| 2021 | $761 +0.9% | $66,491 +1.4% |
| 2020 | $754 +1.8% | $65,573 +2.3% |
| 2019 | $740 | $64,099 +1.9% |
| 2018 | $740 +0.8% | $62,904 -43.1% |
| 2017 | $734 +1.3% | $110,571 +83.2% |
| 2016 | $725 +2.2% | $60,343 +0.7% |
| 2015 | $709 +12.8% | $59,924 +0.8% |
| 2014 | $629 | $59,448 +1.5% |
| 2013 | $629 -2.4% | $58,569 -0.5% |
| 2012 | $644 -10.3% | $58,853 -9.5% |
| 2011 | $718 -10.7% | $65,009 -14.3% |
| 2010 | $804 -36.3% | $75,840 -21.6% |
| 2009 | $1,261 -0.4% | $96,760 +0.1% |
| 2008 | $1,266 -17.5% | $96,663 +3% |
| 2007 | $1,535 -5.3% | $93,848 +2.5% |
| 2006 | $1,620 +1.1% | $91,559 +3% |
| 2005 | $1,602 | $88,892 +3% |
| 2004 | -- | $86,303 +1.9% |
| 2003 | -- | $84,694 +2% |
| 2002 | -- | $83,000 +20.9% |
| 2001 | -- | $68,656 |
Find assessor info on the county website
Monthly payment
Est. payment
Payment breakdown
Explore the cost of this home by adjusting the details. Changes won't be saved.Climate risks
Neighborhood: Southeast Seminole Heights

Similar homes
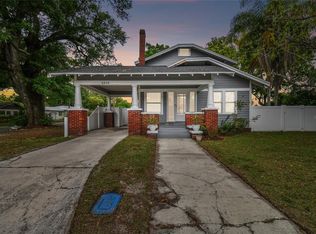
- $600,0007 bd4 ba2.6k sqft402 E EMMA STREET, TAMPA, FL 33603For Sale
 MLS ID #TB8496452, Vicki Strickler PA, PREMIER REALTY. Stellar MLS
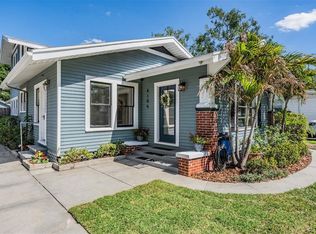
- $550,0005 bd2 ba2k sqft6810 N NAVIN AVENUE, TAMPA, FL 33604For Sale
 MLS ID #TB8565233, Aprilyn Cloyd, REALTY ONE GROUP INNOVATION. Stellar MLS
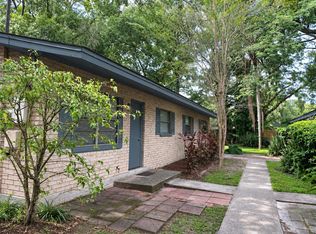
- $535,0005 bd3 ba2k sqft4109 N SEMINOLE AVENUE, TAMPA, FL 33603For Sale
 MLS ID #TB8500224, Julia Wright, KELLER WILLIAMS TAMPA PROPERTIES. Stellar MLS
- $599,0008 bd4 ba2.8k sqft1704 E KIRBY STREET, TAMPA, FL 33604For Sale
 MLS ID #TB8563956, Karen Joyal, ADVANTAGE REALTY SERVICES, INC. Stellar MLS
- $598,0006 bd5 ba2k sqft2000 N 32ND STREET, TAMPA, FL 33605For SaleMLS ID #TB8548961, John Alestra, AGILE GROUP REALTY. Stellar MLS
- $600,0005 bd3 ba2.6k sqft1714 W SAINT ISABEL STREET, TAMPA, FL 33607For SaleMLS ID #TB8493929, Olivia Carbe, AGENTWISE REALTY. Stellar MLS
- $489,0005 bd3 ba2.3k sqft6020 N FLORA VISTA AVENUE, TAMPA, FL 33604For SaleMLS ID #TB8531584, Andrew Duncan, LPT REALTY LLC. Stellar MLS
- $575,0006 bd3 ba2.9k sqft3001 W CHESTNUT STREET, TAMPA, FL 33607For SaleMLS ID #TB8551830, Alfonso DiGirolamo, DIGI REALTY GROUP, INC.. Stellar MLS
- $499,9005 bd3 ba2.1k sqft708 E CRENSHAW STREET, TAMPA, FL 33604For SaleMLS ID #TB8561696, ELIZABETH COLON, EXP REALTY LLC. Stellar MLS
- $522,0005 bd2 ba2k sqft8326 ARCHWOOD CIRCLE, TAMPA, FL 33615For SaleMLS ID #O6455241, Karen Albright, OPENDOOR BROKERAGE LLC. Stellar MLS
- $699,9985 bd3 ba2.3k sqft302 W COMANCHE AVENUE, TAMPA, FL 33604For SaleMLS ID #O6418731, Katie Morrison, KELLER WILLIAMS HERITAGE REALTY. Stellar MLS
- $379,9005 bd3 ba1.5k sqft2005 E NORTH BAY STREET, TAMPA, FL 33610For SaleMLS ID #TB8562455, Bryce Wade, COMPASS FLORIDA, LLC. Stellar MLS
- $599,5006 bd5 ba3.3k sqft2814 W HUMPHREY STREET, TAMPA, FL 33614For SaleMLS ID #TB8465409, Andrew Salamone, COMPASS FLORIDA LLC. Stellar MLS
- $474,9995 bd2 ba2.1k sqft2132 W BEACH STREET, TAMPA, FL 33607For SaleMLS ID #TB8526153, Rachel Sample, SMITH & ASSOCIATES REAL ESTATE. Stellar MLS
- $649,9005 bd3 ba2.3k sqft5114 CHILKOOT STREET, TAMPA, FL 33617For SaleMLS ID #TB8547044, Khairi Salah, ALIGN RIGHT REALTY LLC. Stellar MLS
- $725,0007 bd4 ba3.2k sqft6711 RALSTON BEACH CIRCLE, TAMPA, FL 33614For SaleMLS ID #TB8561215, Keith Daniels, BROOKS REALTY GROUP LLC. Stellar MLS
- $775,0005 bd5 ba3.3k sqft105 W COLUMBUS DRIVE, TAMPA, FL 33602For SaleMLS ID #TB8487057, Deana Cannella, LOMBARDO TEAM REAL ESTATE LLC. Stellar MLS
- $695,0006 bd4 ba3.1k sqft11714 N ROME AVENUE, TAMPA, FL 33612For SaleMLS ID #TB8546429, Jennifer Rutemiller, KELLER WILLIAMS SOUTH TAMPA. Stellar MLS
- $525,0005 bd3 ba2.9k sqft11005 N 27TH STREET, TAMPA, FL 33612For SaleMLS ID #TB8549288, Andrew Duncan, LPT REALTY LLC. Stellar MLS
- $465,0005 bd2 ba1.6k sqft1913 E HANNA AVENUE, TAMPA, FL 33610For SaleMLS ID #TB8542617, Jenine Loche, EPIQUE REALTY INC.. Stellar MLS
