This is a cozy four bedroom, two story home with a large office downstairs. The home showcases separate dining room, living room and kitchen. All of the carpet was recently removed.
Renter pays all utilities. Move in costs, first month, last month and security deposit. No smoking on premises. Small pets allowed.
Pre-foreclosure
Est. $319,900
10305 Frog Pond Dr, Riverview, FL 33569
4beds
2,200sqft
Single Family Residence
Built in ----
-- sqft lot
$319,900 Zestimate®
$145/sqft
$-- HOA
What's special
Two story homeCozy four bedroomSeparate dining roomLarge office downstairs
- 21 days
- 37
- 1
Zillow last checked:
Listing updated:
Source: Zillow Rentals
Facts & features
Interior
Bedrooms & bathrooms
- Bedrooms: 4
- Bathrooms: 3
- Full bathrooms: 2
- 1/2 bathrooms: 1
Heating
- Central
Cooling
- Air Conditioner, Central Air
Appliances
- Included: Dryer, Washer
- Laundry: In Unit
Features
- Flooring: Hardwood
Interior area
- Total interior livable area: 2,200 sqft
Property
Parking
- Parking features: Attached, Garage
- Has attached garage: Yes
- Details: Contact manager
Details
- Additional structures: Garage(s)
- Parcel number: 20302563YA00000000470U
Construction
Type & style
- Home type: SingleFamily
- Property subtype: Single Family Residence
Community & HOA
Community
- Deposit fee: $3,500
Location
- Region: Riverview
Financial & listing details
- Price per square foot: $145/sqft
- Tax assessed value: $264,491
- Annual tax amount: $5,508
- Date on market: 8/26/2026
- Lease term: 1 Year
Foreclosure details
Estimated market value
$319,900
$298,000 - $339,000
$2,551/mo
Price history
| Date | Event | Price |
|---|---|---|
| 9/16/2026 | Listing removed | $2,500$1/sqft |
Source: Zillow Rentals Report a problem | ||
| 8/26/2026 | Listed for rent | $2,500$1/sqft |
Source: Zillow Rentals Report a problem | ||
| 8/13/2026 | Listing removed | $2,500$1/sqft |
Source: Zillow Rentals Report a problem | ||
| 7/22/2026 | Price change | $2,500-7.4%$1/sqft |
Source: Zillow Rentals Report a problem | ||
| 6/25/2026 | Listed for rent | $2,700+58.8%$1/sqft |
Source: Zillow Rentals Report a problem | ||
| 2/26/2021 | Listing removed | -- |
Source: Owner Report a problem | ||
| 6/8/2020 | Listing removed | $1,700$1/sqft |
Source: Owner Report a problem | ||
| 5/15/2020 | Listed for rent | $1,700+6.3%$1/sqft |
Source: Owner Report a problem | ||
| 7/1/2018 | Listing removed | $1,600$1/sqft |
Source: Owner Report a problem | ||
| 6/29/2018 | Listed for rent | $1,600+6.7%$1/sqft |
Source: Zillow Rental Manager Report a problem | ||
| 4/15/2015 | Listing removed | $1,500$1/sqft |
Source: Owner Report a problem | ||
| 3/1/2015 | Listed for rent | $1,500$1/sqft |
Source: Owner Report a problem | ||
| 2/25/2010 | Sold | $140,000+3%$64/sqft |
Source: Public Record Report a problem | ||
| 12/13/2009 | Listed for sale | $135,900$62/sqft |
Source: COLDWELL BANKER ACTION REALTY #7440762 Report a problem | ||
Public tax history
| Year | Property taxes | Tax assessment |
|---|---|---|
| 2025 | $5,508 +8.6% | $264,491 +6.1% |
| 2024 | $5,070 -1.6% | $249,288 +10% |
| 2023 | $5,154 +5.5% | $226,625 +10% |
| 2022 | $4,888 +12.9% | $206,023 +10% |
| 2021 | $4,331 +10.1% | $187,294 +10% |
| 2020 | $3,934 +5.5% | $170,267 +6.2% |
| 2019 | $3,729 | $160,356 +2.9% |
| 2018 | $3,729 +1.6% | $155,893 +11.1% |
| 2017 | $3,671 +7.2% | $140,278 +6.6% |
| 2016 | $3,425 +4.9% | $131,581 +8.7% |
| 2015 | $3,264 +8.5% | $121,026 +10% |
| 2014 | $3,009 | $110,024 +10% |
| 2013 | $3,009 +16.6% | $100,022 +10% |
| 2012 | $2,580 -2.4% | $90,929 -3.2% |
| 2011 | $2,644 -5% | $93,906 -7.5% |
| 2010 | $2,784 +19.4% | $101,542 -15.1% |
| 2009 | $2,332 -21.6% | $119,562 -21.1% |
| 2008 | $2,976 -5.6% | $151,505 +3% |
| 2007 | $3,153 -4.2% | $147,092 +2.5% |
| 2006 | $3,290 +0.2% | $143,504 +3% |
| 2005 | $3,284 | $139,324 +1.6% |
| 2004 | -- | $137,175 +7898.5% |
| 2003 | -- | $1,715 |
Find assessor info on the county website
Monthly payment
Climate risks
Neighborhood: Boyette Creek


Similar homes
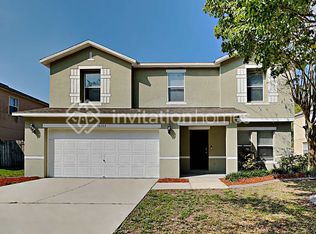
- $350,0004 bd3 ba2.2k sqft10304 RIVER BREAM DRIVE, RIVERVIEW, FL 33569For Sale
 MLS ID #L4964094, Crystal Taylor, LIVE FLORIDA REALTY. Stellar MLS
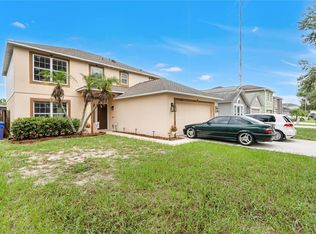
- $350,0003 bd2 ba1.8k sqft13516 COPPER HEAD DRIVE, RIVERVIEW, FL 33569For Sale
 MLS ID #TB8559085, Carl Gresen, LPT REALTY, LLC. Stellar MLS
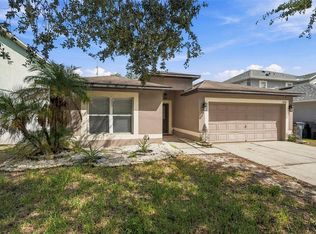
- $--3 bd2 ba1.2k sqft13729 Gentle Woods Ave, Riverview, FL 33569Auction
 Auction.com 2
- $357,5004 bd3 ba2.2k sqft10405 FLY FISHING STREET, RIVERVIEW, FL 33569For Sale
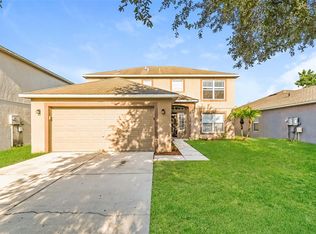 MLS ID #C7517427, Raul Pino, SOVEREIGN REAL ESTATE GROUP. Stellar MLS
- $419,0004 bd3 ba2.2k sqft13531 COPPER HEAD DRIVE, RIVERVIEW, FL 33569For SaleMLS ID #TB8561072, Shawna Calvert, 27NORTH REALTY. Stellar MLS
- $359,9003 bd2 ba1.8k sqft13402 COPPER HEAD DRIVE, RIVERVIEW, FL 33569For SaleMLS ID #S5155645, Lidia Barberini, AGENT TRUST REALTY CORPORATION. Stellar MLS
- $349,9993 bd2 ba1.6k sqft10511 DEEPBROOK DRIVE, RIVERVIEW, FL 33569For SaleMLS ID #TB8548207, Josh Wright, LPT REALTY, LLC. Stellar MLS
- $415,0004 bd3 ba1.9k sqft10306 EARLY MIST LANE, RIVERVIEW, FL 33569For SaleMLS ID #TB8557716, John Scalia, EXP REALTY LLC. Stellar MLS
- $399,9003 bd2 ba1.9k sqft10120 SEDGEBROOK DRIVE, RIVERVIEW, FL 33569For SaleMLS ID #TB8560678, Ann Marie Vaughan, RE/MAX ALLIANCE GROUP. Stellar MLS
- $340,0004 bd3 ba2.6k sqft10208 NEWEL VALLEY LOOP, RIVERVIEW, FL 33569For SaleMLS ID #TB8563709, Cheryl White, KELLER WILLIAMS SOUTH SHORE. Stellar MLS
- $340,0004 bd3 ba1.9k sqft12788 MAPLE BONSAI DRIVE, RIVERVIEW, FL 33579For SaleMLS ID #TB8420924, Latisha Porter, KELLER WILLIAMS SOUTH SHORE. Stellar MLS
- $335,0003 bd2 ba1.4k sqft12108 FRUITWOOD DRIVE, RIVERVIEW, FL 33569For SaleMLS ID #TB8560776, Han Bautista, WEICHERT, REALTORS - NEXON. Stellar MLS
- $299,0003 bd2 ba1.5k sqft12009 GLENHILL DRIVE, RIVERVIEW, FL 33569For SaleMLS ID #TB8560045, Arlen Franz, INTEGRITY REAL ESTATE ADVISORS. Stellar MLS
- $350,0004 bd3 ba2.2k sqft8309 TIDAL BREEZE DRIVE, RIVERVIEW, FL 33569For SaleMLS ID #W7889180, Zachary Hodges, HOMAN REALTY GROUP INC. Stellar MLS
- $375,0004 bd2 ba2k sqft11323 BRIDGE PINE DRIVE, RIVERVIEW, FL 33569For SaleMLS ID #TB8562417, Efrain Jovel, PA, RE/MAX ALLIANCE GROUP. Stellar MLS
- $385,0005 bd3 ba2.5k sqft12111 LILY MAGNOLIA LANE, RIVERVIEW, FL 33569For SaleMLS ID #TB8563695, Trevor Skeens, RE/MAX REALTY UNLIMITED. Stellar MLS
- $368,0004 bd2 ba1.9k sqft9703 GLENPOINTE DRIVE, RIVERVIEW, FL 33569For SaleMLS ID #O6445925, Karen Albright, OPENDOOR BROKERAGE LLC. Stellar MLS
- $389,9003 bd2 ba1.7k sqft10654 PLANER PICKET DRIVE, RIVERVIEW, FL 33569For SaleMLS ID #TB8562316, Kelly Heldreth, KELLER WILLIAMS SUBURBAN TAMPA. Stellar MLS
- $335,0003 bd2 ba1.7k sqft11706 PURE PEBBLE DRIVE, RIVERVIEW, FL 33569For SaleMLS ID #TB8541450, Michelle Griffin, PINEYWOODS REALTY LLC. Stellar MLS
- $429,0003 bd3 ba2.4k sqft11425 BLUE CRANE STREET, RIVERVIEW, FL 33569New ConstructionMLS ID #TB8561505, Heather Lesikar, CENTURY 21 LINK REALTY, INC.. Stellar MLS
