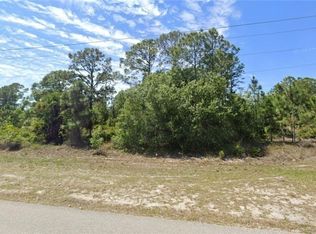
Cash or Financed Lot available for sale in Lehigh Acres. Ready to built your dream home. Surrounded by multiple new constructions that support the market value. Don't miss out this opportunity to build your dream home in the fastest growing area of Lehigh Acres.
Active
Price cut: $1K (8/4)
$20,990
1039 Binkley St E, Lehigh Acres, FL 33974
--beds
--baths
0.26Acres
Unimproved Land
Built in ----
0.26 Acres Lot
$-- Zestimate®
$--/sqft
$-- HOA
What's special
- 194 days
- 2
- 0
Zillow last checked:
Listing updated:
Listed by:
Yuley Vazquez Stiven 239-292-2018,
Premium Estates Realty Corp
Source: Florida Gulf Coast MLS,MLS#: 2026018514 Originating MLS: Florida Gulf Coast
Facts & features
Interior
Video & virtual tour
Property
Features
- Pool features: Community
- Has view: Yes
- View description: Landscaped
- Waterfront features: Canal Access
Lot
- Size: 0.26 Acres
- Dimensions: 90 x 125 x 90 x 125
- Features: Rectangular Lot, See Remarks
- Residential vegetation: Grassed
Details
- Parcel number: 024527L309056.0360
- Lease amount: $0
- Zoning description: RS-1
Utilities & green energy
- Sewer: Septic Tank
- Water: Well
- Utilities for property: None
Community & HOA
Community
- Features: Non-Gated, Pool
- Condo and coop fee: $0
- Membership fee: $0
- Subdivision: LEHIGH ACRES
HOA
- Has HOA: Yes
- Amenities included: Other
- Services included: None
Location
- Region: Lehigh Acres
Financial & listing details
- Tax assessed value: $15,343
- Annual tax amount: $435
- Date on market: 4/22/2026
- Cumulative days on market: 194 days
- Listing terms: Cash
Estimated market value
Not available
Estimated sales range
Not available
Not available
Price history
| Date | Event | Price |
|---|---|---|
| 8/4/2026 | Price change | $20,990-4.5% |
Source:  Florida Gulf Coast MLS #2026018514 Report a problem | ||
| 4/22/2026 | Listed for sale | $21,990-10.2% |
Source: Florida Gulf Coast MLS #2026018514 Report a problem | ||
| 10/1/2025 | Listing removed | $24,500 |
Source: Florida Gulf Coast MLS #225026245 Report a problem | ||
| 9/30/2025 | Price change | $24,500+14% |
Source: Florida Gulf Coast MLS #225026245 Report a problem | ||
| 7/31/2025 | Price change | $21,500-15.7% |
Source: Florida Gulf Coast MLS #225026245 Report a problem | ||
| 5/31/2025 | Price change | $25,500-3.8% |
Source:  SWFLMLS #225026245 Report a problem | ||
| 3/15/2025 | Listed for sale | $26,500+82.8% |
Source: SWFLMLS #225026245 Report a problem | ||
| 9/1/2023 | Sold | $14,500-3.3% |
Source: Florida Gulf Coast MLS #223050693 Report a problem | ||
| 7/28/2023 | Pending sale | $15,000 |
Source:  Florida Gulf Coast MLS #223050693 Report a problem | ||
| 7/12/2023 | Listed for sale | $15,000 |
Source: Florida Gulf Coast MLS #223050693 Report a problem | ||
| 1/12/2023 | Listing removed | -- |
Source: Florida Gulf Coast MLS #222046765 Report a problem | ||
| 8/18/2022 | Price change | $15,000-50% |
Source: Florida Gulf Coast MLS #222046765 Report a problem | ||
| 6/17/2022 | Listed for sale | $30,000+689.5% |
Source: Florida Gulf Coast MLS #222046765 Report a problem | ||
| 12/15/2019 | Listing removed | $3,800 |
Source: RE/MAX Trend #219050165 Report a problem | ||
| 12/14/2019 | Listed for sale | $3,800+8.6% |
Source: RE/MAX Trend #219050165 Report a problem | ||
| 12/13/2019 | Sold | $3,500-7.9% |
Source: Florida Gulf Coast MLS #219050165 Report a problem | ||
| 11/27/2019 | Pending sale | $3,800 |
Source: RE/MAX Trend #219050165 Report a problem | ||
| 10/22/2019 | Price change | $3,800-5% |
Source: RE/MAX Trend #219050165 Report a problem | ||
| 8/26/2019 | Listed for sale | $4,000 |
Source: RE/MAX Trend #219050165 Report a problem | ||
| 8/13/2019 | Pending sale | $4,000 |
Source: RE/MAX Trend #219050165 Report a problem | ||
| 7/24/2019 | Listed for sale | $4,000+17.6% |
Source: RE/MAX Trend #219050165 Report a problem | ||
| 7/1/2016 | Sold | $3,400-3.5% |
Source:  Florida Gulf Coast MLS #216018529 Report a problem | ||
| 6/15/2016 | Pending sale | $3,525 |
Source: Miloff Aubuchon Realty Group #216018529 Report a problem | ||
| 6/7/2016 | Price change | $3,525-5.4% |
Source: Miloff Aubuchon Realty Group #216018529 Report a problem | ||
| 3/10/2016 | Listed for sale | $3,725 |
Source: Miloff Aubuchon Realty Group, #216018529 Report a problem | ||
Public tax history
| Year | Property taxes | Tax assessment |
|---|---|---|
| 2025 | $436 +9.4% | $13,510 +10% |
| 2024 | $398 +24% | $12,282 +146% |
| 2023 | $321 +12.7% | $4,992 +10% |
| 2022 | $285 +9% | $4,538 +10% |
| 2021 | $261 +1.5% | $4,125 +10% |
| 2020 | $257 +129.1% | $3,750 +1.4% |
| 2019 | $112 | $3,700 |
| 2018 | $112 +10.1% | $3,700 +27.3% |
| 2017 | $102 +10.1% | $2,907 -27.3% |
| 2016 | $93 -10.9% | $4,000 +37.9% |
| 2015 | $104 +18% | $2,900 +12.2% |
| 2014 | $88 +22.9% | $2,585 +12.4% |
| 2013 | $72 -0.8% | $2,300 -12.2% |
| 2012 | $72 -11.2% | $2,620 -15.5% |
| 2011 | $81 -1.2% | $3,100 |
| 2010 | $82 -19.2% | $3,100 -29.5% |
| 2009 | $102 -50.5% | $4,400 -61.7% |
| 2008 | $206 -33.1% | $11,500 -35.4% |
| 2007 | $308 -54.4% | $17,800 -55.5% |
| 2006 | $675 +745.8% | $40,000 +1190.3% |
| 2004 | $80 +38% | $3,100 +63.2% |
| 2003 | $58 +36.7% | $1,900 +72.7% |
| 2002 | $42 | $1,100 |
| 2000 | -- | $1,100 |
Find assessor info on the county website
Monthly payment
Climate risks
Neighborhood: 33974
- $15,343-- bd-- ba-- sqft1041 Binkley St E, Lehigh Acres, FL 33974Off Market
- $15,343-- bd-- ba-- sqft1037 Binkley St E, Lehigh Acres, FL 33974Off Market
- $273,3004 bd2 ba1.7k sqft1038 Binkley St E, Lehigh Acres, FL 33974Off Market
- $15,343-- bd-- ba-- sqft1043 Binkley St E, Lehigh Acres, FL 33974Off Market
Similar homes
- $18,0000.29 acres220 McArthur Blvd, Lehigh Acres, FL 33974Lot/Land
 MLS ID #2026031804, Lisa Jackson, Century 21 Selling Paradise. Florida Gulf Coast MLS
- $29,00011,125 acresN/A, Lehigh Acres, FL 33974Lot/Land
 MLS ID #A12032685, Eliza Seraphin, Lifestyle International Realty. MIAMI
- $20,90010,018 sqftLehigh Acres, Lehigh Acres, FL 33974Lot/Land
 MLS ID #A12036460, Vanesa Gagliolo, Costa Miami Realty, LLC. MIAMI
- $19,50010,624 sqftLehigh Acres, Lehigh Acres, FL 33974Lot/Land
 MLS ID #A12110311, Erika Hinton, Arinton Realty, LLC. MIAMI
- $26,0000.34 acres1028 Hansen St E, Lehigh Acres, FL 33974Lot/LandMLS ID #2026043749, Samir Naim, Naim Real Estate LLC. Florida Gulf Coast MLS
- $19,9000.25 acres1042 Manning ST, LEHIGH ACRES, FL 33974Lot/Land
 MLS ID #226015651, Astrid Hayes, Realty World J. PAVICH R.E.. SWFLMLS
- $16,89010,249 sqft1243 Cordoba St E, Lehigh Acres, FL 33974Lot/LandMLS ID #2026041655, Karl Erickson, Florida Homes Realty & Mortgage. Florida Gulf Coast MLS
- $14,9009,997 sqft329 Broward Ave, Lehigh Acres, FL 33974Lot/LandMLS ID #2026043187, R.J. Dean, Porter Davis Real Estate. Florida Gulf Coast MLS
- $18,5009,988 sqft456 Hull Ave S, Lehigh Acres, FL 33974Lot/LandMLS ID #2026027430, Bart Castro, Florida Prime Real Estate LLC. Florida Gulf Coast MLS
- $17,9000.28 acres921 Abbey St E, Lehigh Acres, FL 33974Lot/LandMLS ID #2026022516, R.J. Dean, Porter Davis Real Estate. Florida Gulf Coast MLS
- $16,10010,001 sqft747 Milano Ave S, Lehigh Acres, FL 33974Lot/LandMLS ID #2026042040, Bruno Franco, RE/MAX Realty Team. Florida Gulf Coast MLS
- $24,99910,506 sqft909 Butler St E, Lehigh Acres, FL 33974Lot/LandMLS ID #2025017895, A.D. Diaz, Century 21 Sunbelt Realty. Florida Gulf Coast MLS
- $30,0000.26 acres237 Nebraska Ave, Lehigh Acres, FL 33974Lot/LandMLS ID #2026017969, Lissette Guillen Guillen, EXP Realty LLC. Florida Gulf Coast MLS
- $23,00010,001 sqft343 Columbus Blvd S, Lehigh Acres, FL 33974Lot/LandMLS ID #2026014186, Samir Naim, Naim Real Estate LLC. Florida Gulf Coast MLS
- $23,00010,001 sqft341 Columbus Blvd S, Lehigh Acres, FL 33974Lot/LandMLS ID #2026014185, Samir Naim, Naim Real Estate LLC. Florida Gulf Coast MLS
- $25,9000.25 acresLehich Acres, Lehigh Acres, FL 33974Lot/LandMLS ID #A12109156, Karina Sabadell, United Realty Group Inc.. MIAMI
- $30,0000.32 acres1016 Milwaukee Blvd, Lehigh Acres, FL 33974Lot/LandMLS ID #2026022535, Gerhard Rodriguez Gil, Avanti Way Realty LLC. Florida Gulf Coast MLS
- $28,0000.28 acres822 Appleton AVE, LEHIGH ACRES, FL 33974Lot/LandMLS ID #226033690, Ismely Evora, Realty One Group MVP. SWFLMLS
- $17,99910,001 sqft1107 Fogia St E, Lehigh Acres, FL 33974Lot/LandMLS ID #2026031803, Lisa Jackson, Century 21 Selling Paradise. Florida Gulf Coast MLS
- $19,5000.25 acres3806 E 13TH STREET LOT 24, LEHIGH ACRES, FL 33972Lot/Land
 MLS ID #C7498598, Patricia Wisch, EXIT GULF COAST REALTY. Stellar MLS
