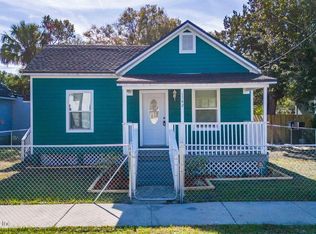
Welcome to this beautifully renovated 3-bedroom, 2-bathroom home offering 902 Sq ft of living space, this property featuring vinyl plank flooring throughout and a kitchen outfitted with stainless- steel appliances.
Whether you are a first -time homebuyer seeking a low maintenance start or an investor looking to grow their portfolio, strong rental pottential in the $1400+ per month range in the current market.
Active
$120,000
1138 E 13TH Street, Jacksonville, FL 32206
3beds
902sqft
Single Family Residence
Built in 1910
5,227 Square Feet Lot
$115,000 Zestimate®
$133/sqft
$-- HOA
What's special
Vinyl plank flooring throughout
- 43 days
- 203
- 22
Likely to sell faster than
Zillow last checked:
Listing updated:
Listed by:
MARIE ABRAHAM 904-401-6073,
KINGDOM BUILDERS REALTY & PROPERTY MANAGEMENT LLC 904-401-6073
Source: realMLS,MLS#: 2165323
Facts & features
Interior
Bedrooms & bathrooms
- Bedrooms: 3
- Bathrooms: 2
- Full bathrooms: 2
Heating
- Central
Cooling
- Central Air
Appliances
- Included: Convection Oven, Dishwasher, Electric Oven, Electric Range
Interior area
- Total interior livable area: 902 sqft
Property
Parking
- Parking features: On Street
- Has uncovered spaces: Yes
Features
- Levels: One
- Stories: 1
Lot
- Size: 5,227 Square Feet
Details
- Parcel number: 1136820000
- Zoning description: Residential
Construction
Type & style
- Home type: SingleFamily
- Architectural style: Traditional
- Property subtype: Single Family Residence
Condition
- Updated/Remodeled
- New construction: No
- Year built: 1910
Utilities & green energy
- Water: Public
- Utilities for property: Electricity Available, Water Available
Community & HOA
Community
- Subdivision: Clark Addition
HOA
- Has HOA: No
Location
- Region: Jacksonville
Financial & listing details
- Price per square foot: $133/sqft
- Tax assessed value: $49,221
- Annual tax amount: $1,224
- Date on market: 9/17/2026
- Listing terms: Cash,Conventional
- Road surface type: Asphalt
Estimated market value
$115,000
$109,000 - $121,000
$1,261/mo
Price history
| Date | Event | Price |
|---|---|---|
| 9/17/2026 | Listed for sale | $120,000-3.2%$133/sqft |
Source:  realMLS #2165323 Report a problem | ||
| 11/28/2025 | Listing removed | $124,000$137/sqft |
Source: realMLS #2104535 Report a problem | ||
| 11/12/2025 | Price change | $124,000-0.8%$137/sqft |
Source: realMLS #2104535 Report a problem | ||
| 9/22/2025 | Price change | $125,000-3.8%$139/sqft |
Source: realMLS #2104535 Report a problem | ||
| 8/19/2025 | Listed for sale | $130,000+132.1%$144/sqft |
Source: realMLS #2104535 Report a problem | ||
| 7/30/2020 | Sold | $56,000+1202.3%$62/sqft |
Source: Agent Provided Report a problem | ||
| 6/13/2016 | Sold | $4,300+1.8%$5/sqft |
Source: Public Record Report a problem | ||
| 4/6/2016 | Sold | $4,225-23.2%$5/sqft |
Source: Public Record Report a problem | ||
| 1/21/2010 | Sold | $5,500-88%$6/sqft |
Source: Public Record Report a problem | ||
| 9/29/2006 | Sold | $46,000-7.8%$51/sqft |
Source: Public Record Report a problem | ||
| 6/1/2000 | Sold | $49,900$55/sqft |
Source: Public Record Report a problem | ||
Public tax history
| Year | Property taxes | Tax assessment |
|---|---|---|
| 2025 | $1,225 +24.8% | $48,984 +9.5% |
| 2024 | $981 +20.4% | $44,733 +41.8% |
| 2023 | $815 +16.9% | $31,550 +10% |
| 2022 | $697 +9.3% | $28,682 +10% |
| 2021 | $638 +1.8% | $26,075 +3.2% |
| 2020 | $627 -1.1% | $25,275 -0.1% |
| 2019 | $634 +0.5% | $25,312 +1.7% |
| 2018 | $631 | $24,900 +5% |
| 2017 | $631 +2.7% | $23,710 +22.3% |
| 2016 | $614 +13.3% | $19,390 -28.3% |
| 2015 | $542 -21.8% | $27,056 +5.5% |
| 2014 | $693 | $25,650 +6% |
| 2013 | -- | $24,205 -3.3% |
| 2012 | -- | $25,027 -27.5% |
| 2011 | -- | $34,498 -9.4% |
| 2010 | -- | $38,059 -10.4% |
| 2009 | -- | $42,457 -22% |
| 2006 | -- | $54,456 +10.8% |
| 2005 | $913 | $49,132 +7.4% |
| 2004 | -- | $45,732 +2.9% |
| 2003 | $862 | $44,432 +1.8% |
| 2002 | -- | $43,632 +2.5% |
| 2001 | -- | $42,550 +283.7% |
| 2000 | -- | $11,088 +1.8% |
| 1999 | -- | $10,888 |
Find assessor info on the county website
Monthly payment
Est. payment
Payment breakdown
Explore the cost of this home by adjusting the details. Changes won't be saved.Climate risks
Neighborhood: Phoenix
Similar homes
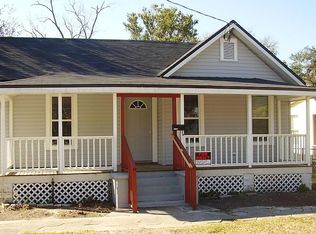
- $105,0003 bd1 ba1.1k sqft1931 LAMBERT Street, Jacksonville, FL 32206For Sale
 MLS ID #2171658, BETHANY RAMOS. realMLS
- $105,0003 bd1 ba1.1k sqft1937 LAMBERT Street, Jacksonville, FL 32206For Sale
 MLS ID #2171659, BETHANY RAMOS. realMLS
- $119,0003 bd1 ba888 sqft653 E 28TH Street, Jacksonville, FL 32206For Sale
 MLS ID #2157177, FRANCES LITTLETON. realMLS
- $105,0003 bd1 ba1k sqft340 BIRCH Street, Jacksonville, FL 32206For Sale
 MLS ID #2162015, JENNIFER DAVIS. realMLS
- $115,0003 bd1 ba770 sqft5551 VERBENA ROAD, JACKSONVILLE, FL 32209For Sale
 MLS ID #O6450551, Lashaunda Stallworth, NONA LEGACY POWERED BY LA ROSA. Stellar MLS
- $105,0003 bd2 ba990 sqft804 W 29TH STREET, JACKSONVILLE, FL 32209For SaleMLS ID #TB8523854, Victor Carranza, 3 POINT REAL ESTATE. Stellar MLS
