ATTENTION INVESTORS!!! MULTIPLE INCOME STREAM POTENTIAL! PROVEN TRACK RECORD AND CURRENT TENNANTS IN PLACE FOR THE HOLIDAY SEASON. Wooded area 6 miles to beautiful beaches! Property allows tranquil seclusion and a unique opportunity as an investor or home owner to utilize income earnings and potential for additional earnings. Zoning allows for business to be conducted however the owner may see fit. Discover this charming home off a main exit only 5 miles to the bustling Downtown in USA's oldest city. This property features a furnished spacious living area, a well-equipped kitchen with modern appliances, and comfortable bedrooms. Warehouse/garage designed for live-workspace. Mower and sheds. The home is set on a generous shaded lot, ample outdoor space for relaxation and enjoyment, storage, and income potential! Conveniently located near local amenities, it provides easy access to the city! Neighbors all very helpful and welcoming!
For sale
$329,500
1611 Brian Way, Saint Augustine, FL 32084
3beds
1,098sqft
Single Family Residence
Built in 1984
0.74 Acres Lot
$-- Zestimate®
$300/sqft
$-- HOA
What's special
- 340 days
- 281
- 25
Zillow last checked:
Listing updated:
Listed by:
Steven Koleno 804-656-5007,
Beycome Brokerage Realty
Source: St Augustine St Johns County BOR,MLS#: 256436
Facts & features
Interior
Bedrooms & bathrooms
- Bedrooms: 3
- Bathrooms: 2
- Full bathrooms: 2
Primary bedroom
- Level: First
- Area: 132
- Dimensions: 12 x 11
Features
- Flooring: Vinyl
Interior area
- Total structure area: 1,098
- Total interior livable area: 1,098 sqft
Property
Features
- Stories: 1
- Entry location: Ground Level
Lot
- Size: 0.74 Acres
- Features: 1/2 to 1 Acre
Details
- Parcel number: 1007560080
- Zoning: RMH
Construction
Type & style
- Home type: SingleFamily
- Property subtype: Single Family Residence
Materials
- Roof: Metal
Condition
- New construction: No
- Year built: 1984
Community & HOA
Community
- Subdivision: Lyndale Acres
HOA
- Has HOA: No
Location
- Region: Saint Augustine
Financial & listing details
- Price per square foot: $300/sqft
- Tax assessed value: $161,581
- Annual tax amount: $2,519
- Price range: $329.5K - $329.5K
- Date on market: 11/25/2025
Estimated market value
Not available
Estimated sales range
Not available
Not available
Price history
| Date | Event | Price |
|---|---|---|
| 10/16/2026 | Listed for sale | $329,500-2.8%$300/sqft |
Source:  St Augustine St Johns County BOR #256436 Report a problem | ||
| 9/20/2026 | Listing removed | $339,000$309/sqft |
Source: St Augustine St Johns County BOR #256436 Report a problem | ||
| 5/18/2026 | Price change | $339,000-2.6%$309/sqft |
Source: St Augustine St Johns County BOR #256436 Report a problem | ||
| 4/8/2026 | Price change | $348,000-1.1%$317/sqft |
Source: St Augustine St Johns County BOR #256436 Report a problem | ||
| 2/20/2026 | Price change | $352,000-0.8%$321/sqft |
Source: St Augustine St Johns County BOR #256436 Report a problem | ||
| 1/29/2026 | Listed for sale | $355,000-2.4%$323/sqft |
Source: St Augustine St Johns County BOR #256436 Report a problem | ||
| 1/7/2026 | Listing removed | $363,700$331/sqft |
Source: St Augustine St Johns County BOR #256436 Report a problem | ||
| 11/25/2025 | Listed for sale | $363,700+205.6%$331/sqft |
Source: St Augustine St Johns County BOR #256436 Report a problem | ||
| 9/20/2021 | Sold | $119,000-4.8%$108/sqft |
Source:  realMLS #1126439 Report a problem | ||
| 8/8/2021 | Listed for sale | $125,000+108.3%$114/sqft |
Source: Owner Report a problem | ||
| 8/4/2014 | Listing removed | $60,000$55/sqft |
Source: The St Johns Realty Group #140730 Report a problem | ||
| 2/16/2014 | Listed for sale | $60,000$55/sqft |
Source: The St Johns Realty Group #140730 Report a problem | ||
| 1/11/2014 | Listing removed | $60,000$55/sqft |
Source: The St Johns Realty Group #140587 Report a problem | ||
| 1/9/2014 | Listed for sale | $60,000$55/sqft |
Source: The St Johns Realty Group #140587 Report a problem | ||
| 12/2/2013 | Listing removed | $60,000$55/sqft |
Source: The St Johns Realty Group #140730 Report a problem | ||
| 1/18/2013 | Listed for sale | $60,000-11.6%$55/sqft |
Source: The St Johns Realty Group #140730 Report a problem | ||
| 9/22/2005 | Sold | $67,900$62/sqft |
Source: Public Record Report a problem | ||
Public tax history
| Year | Property taxes | Tax assessment |
|---|---|---|
| 2025 | $2,519 +19.3% | $161,581 +9.6% |
| 2024 | $2,113 +21.6% | $147,494 +26.5% |
| 2023 | $1,737 +9.1% | $116,553 +10.5% |
| 2022 | $1,592 +59.7% | $105,486 +50.6% |
| 2021 | $997 +4.3% | $70,041 +4.8% |
| 2020 | $956 +1.5% | $66,855 +3.8% |
| 2019 | $942 | $64,389 +12.3% |
| 2018 | $942 +34.1% | $57,350 +72.6% |
| 2017 | $703 | $33,226 |
| 2016 | $703 -3.1% | $33,226 -2.3% |
| 2015 | $725 -3.9% | $33,991 -0.1% |
| 2014 | $755 | $34,021 -2.5% |
| 2013 | -- | $34,888 -1.3% |
| 2012 | -- | $35,347 -10.9% |
| 2011 | -- | $39,657 +3% |
| 2010 | -- | $38,514 -16.3% |
| 2009 | -- | $46,014 -9.8% |
| 2008 | -- | $51,014 -21.8% |
| 2007 | -- | $65,213 -1.5% |
| 2006 | -- | $66,180 +107.8% |
| 2005 | -- | $31,848 +3% |
| 2004 | -- | $30,920 +0.7% |
| 2003 | -- | $30,704 +2.4% |
| 2002 | -- | $29,984 +1.6% |
| 2001 | -- | $29,512 +3% |
| 2000 | -- | $28,652 |
Find assessor info on the county website
Monthly payment
Est. payment
Payment breakdown
Explore the cost of this home by adjusting the details. Changes won't be saved.Climate risks
Neighborhood: 32084


Similar homes
- $345,0003 bd2 ba1.5k sqft2751 N Screech Owl Ave, Saint Augustine, FL 32084For Sale
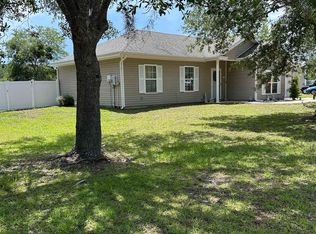 MLS ID #263078, Sheila Clark, PA, Watson Realty Corp (A1A). St Augustine St Johns County BOR
- $310,0003 bd2 ba1.1k sqft1160 N Volusia St, Saint Augustine, FL 32084For Sale
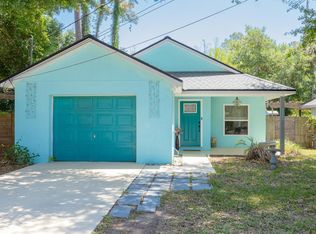 MLS ID #262290, Michael Sharman, ONE Sotheby's Int A1A Beach. St Augustine St Johns County BOR
- $300,0004 bd2 ba1.4k sqft41 N WHITNEY Street, St. Augustine, FL 32084For Sale
 MLS ID #2147725, ANYA OXENDINE. realMLS
- $349,0003 bd2 ba1.2k sqft80 Bruen St, Saint Augustine, FL 32084For Sale
 MLS ID #262905, Oliver Mcleod, STA Realty LLC. St Augustine St Johns County BOR
