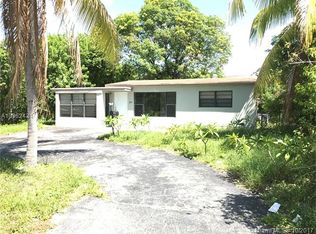
This 1181 square foot single family home has 3 bedrooms and 2.0 bathrooms. This home is located at 2201 NE 3rd Ave, Pompano Beach, FL 33064.
Pre-foreclosure
Street View
Est. $380,400
2201 NE 3rd Ave, Pompano Beach, FL 33064
3beds
2baths
1,181sqft
SingleFamily
Built in 1962
6,962 Square Feet Lot
$380,400 Zestimate®
$322/sqft
$-- HOA
Overview
- 34 days
- 10
- 0
Facts & features
Interior
Bedrooms & bathrooms
- Bedrooms: 3
- Bathrooms: 2
Features
- Flooring: Tile, Concrete
Interior area
- Total interior livable area: 1,181 sqft
Property
Features
- Exterior features: Stucco, Cement / Concrete
Lot
- Size: 6,962 Square Feet
Details
- Parcel number: 484226090820
Construction
Type & style
- Home type: SingleFamily
Materials
- masonry
- Foundation: Other
- Roof: Tile
Condition
- Year built: 1962
Community & HOA
Location
- Region: Pompano Beach
Financial & listing details
- Price per square foot: $322/sqft
- Tax assessed value: $334,850
- Annual tax amount: $1,055
Foreclosure details
Estimated market value
$380,400
$350,000 - $407,000
$2,572/mo
Price history
| Date | Event | Price |
|---|---|---|
| 5/5/2006 | Sold | $230,000+147.3%$195/sqft |
Source: Public Record Report a problem | ||
| 11/19/2001 | Sold | $93,000+90.2%$79/sqft |
Source: Public Record Report a problem | ||
| 2/4/1999 | Sold | $48,900+35.5%$41/sqft |
Source: Public Record Report a problem | ||
| 12/7/1998 | Sold | $36,100+4.6%$31/sqft |
Source: Public Record Report a problem | ||
| 8/27/1998 | Sold | $34,500$29/sqft |
Source: Public Record Report a problem | ||
Public tax history
| Year | Property taxes | Tax assessment |
|---|---|---|
| 2025 | $1,055 +5.5% | $76,750 +2.9% |
| 2024 | $1,000 +0.2% | $74,590 +3% |
| 2023 | $998 +12.5% | $72,420 +3% |
| 2022 | $887 +4.1% | $70,320 +3% |
| 2021 | $852 +1.7% | $68,280 +1.4% |
| 2020 | $838 +0.3% | $67,340 +2.3% |
| 2019 | $836 | $65,830 +1.9% |
| 2018 | $836 +3.8% | $64,610 +2.1% |
| 2017 | $805 +8.2% | $63,290 +2.1% |
| 2016 | $744 +3.5% | $61,990 +0.7% |
| 2015 | $719 -2.7% | $61,560 +0.8% |
| 2014 | $739 | $61,080 -26.6% |
| 2013 | $739 +2.3% | $83,180 +40.6% |
| 2012 | $723 -4.2% | $59,180 -10.3% |
| 2011 | $754 -39.1% | $65,960 -30.1% |
| 2010 | $1,239 -56.1% | $94,410 -45.9% |
| 2009 | $2,824 -9.8% | $174,650 -11.7% |
| 2008 | $3,131 -8.6% | $197,720 -2.1% |
| 2007 | $3,425 +0.9% | $201,880 +29.1% |
| 2006 | $3,394 | $156,320 +32.5% |
| 2005 | -- | $118,000 +24.7% |
| 2004 | $2,316 +4.3% | $94,640 +6% |
| 2003 | $2,221 +16.2% | $89,280 +20% |
| 2002 | $1,911 +49.2% | $74,400 +50.2% |
| 2001 | $1,281 +11.1% | $49,530 |
| 2000 | $1,152 | -- |
Find assessor info on the county website
Monthly payment
Climate risks
Neighborhood: Kendall Green

Similar homes
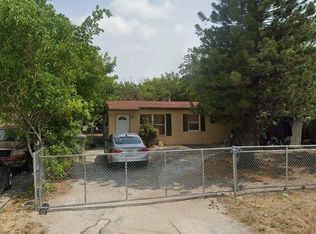
- $419,0003 bd2 ba950 sqftSanders Park, Pompano Beach, FL 33060For Sale
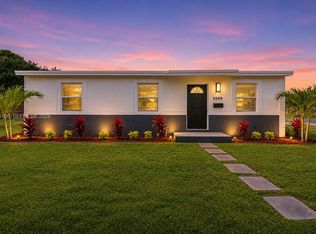
 MLS ID #A12125195, Erika Martinez-lopez, Luxe Properties. MIAMI
- $379,0004 bd2 ba1.2k sqftVera Villas 1st Sec, Pompano Beach, FL 33060For Sale
 MLS ID #A12061311, Kevin Rohrer, LoKation. MIAMI
- $425,0003 bd2 ba1.3k sqft221 NW 38TH Street, Deerfield Beach, FL 33064For Sale

 MLS ID #B26101049, Walner Decius, United Realty Group Inc.. BeachesMLS
- $425,0004 bd2 ba1.1k sqftCresthaven No 6, Pompano Beach, FL 33064For Sale
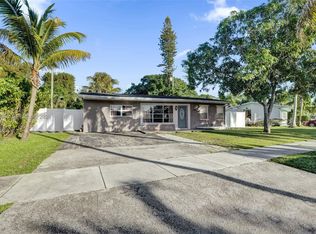 MLS ID #A12119886, Francesco Fassioli, Kariza Capital Realty, LLC. MIAMI
- $369,5002 bd2 ba1.5k sqft3221 E Golf Boulevard, Pompano Beach, FL 33064For SaleMLS ID #B26098074, Devin Mckinney, Serhant. BeachesMLS
- $330,0003 bd2 ba1.2k sqftPompano Highlands, Pompano Beach, FL 33064For SaleMLS ID #A12115811, Rafael Descarga, Miami Trust Realty Inc. MIAMI
- $349,9992 bd2 ba1.4k sqft2631 W Golf Boulevard, Pompano Beach, FL 33064For SaleMLS ID #B26095134, Laura E Sanders, RE/MAX Direct. BeachesMLS
- $429,9993 bd2 ba1.1k sqft2610 NE 8th Avenue, Pompano Beach, FL 33064For SaleMLS ID #B26069378, Clara Messina, Home Prime Realty LLC. BeachesMLS
- $375,0003 bd2 ba1.2k sqftFaulkner Park, Pompano Beach, FL 33064For SaleMLS ID #A12078137, Cristina Moinelo, CBA Realty & Property Mgmt.. MIAMI
- $410,0005 bd2 ba1.5k sqft2330 NE 1ST Avenue, Pompano Beach, FL 33060For SaleMLS ID #B26087065, Natasha Cynthia Mason, Kingdom Keys Home Solutions, I. BeachesMLS
- $450,0002 bd3 ba1.1k sqftCresthaven No 8, Pompano Beach, FL 33064For SaleMLS ID #A12114209, Minerva Strum, RE/MAX Concierge. MIAMI
- $445,5003 bd2 ba1.2k sqft2448 NE 13TH Avenue, Pompano Beach, FL 33064For SaleMLS ID #B26089744, David L Bourns, Society Realty. BeachesMLS
- $399,9993 bd2 ba1.6k sqft2070 NE 2nd Avenue, Pompano Beach, FL 33060For SaleMLS ID #F10545531, Louidor Charite, Well & Well Real Estate Inc.. BeachesMLS
- $299,9992 bd2 ba1.1k sqft216 NE 26TH Court, Pompano Beach, FL 33064For SaleMLS ID #B26094745, Victor Manuel Alfaro, Compass Florida, LLC. BeachesMLS
- $380,0003 bd1 ba1k sqft1780 NW 6TH Terrace, Pompano Beach, FL 33060For SaleMLS ID #B26074057, Constance B Johnson, The Luxury Home Team of Florida. BeachesMLS
- $420,0003 bd2 ba1.2k sqft1630 NE 34TH Street, Pompano Beach, FL 33064For SaleMLS ID #B26064257, Lionel Francillon, Hot Team Realty & Investmt Srv. BeachesMLS
- $450,0003 bd1 ba991 sqft2531 NE 7TH TERRACE, POMPANO BEACH, FL 33064For Sale
 MLS ID #TB8552241, Yarelys Torres, EXP REALTY LLC. Stellar MLS
- $396,0004 bd2 ba1.2k sqft1640 NE 32ND Place, Pompano Beach, FL 33064For SaleMLS ID #B26056055, Teresa Hardy Homan, Mainstay Brokerage LLC. BeachesMLS
- $460,0003 bd2 ba1.1k sqft2711 NE 11TH Terrace, Pompano Beach, FL 33064For SaleMLS ID #B26087263, Jomary Colon, Lokation. BeachesMLS
- $440,0003 bd2 ba993 sqftCollier Manor First Add, Pompano Beach, FL 33064For SaleMLS ID #A12101064, Alberto Vasquez, Keller Williams Realty SW. MIAMI
