Under contract-accepting backup offers. Priced to Sell! Don’t miss this opportunity! 3-bedroom, 1-bath home sits on a spacious lot with tile flooring throughout, no HOA, and located in Flood Zone X. The property needs some love and updating, making it a great opportunity whether you're looking for an investment property or a home to renovate and make your own. Conveniently located with easy access to I-4, I-275, and major Tampa roadways, you'll be just minutes from Downtown Tampa, Ybor City, shopping, dining, entertainment, and everyday conveniences. Bring your vision and take advantage of this great opportunity!
Accepting backups
Price cut: $10K (10/13)
$179,000
2705 E 22ND AVENUE, TAMPA, FL 33605
3beds
896sqft
Single Family Residence
Built in 1999
4,750 Square Feet Lot
$172,100 Zestimate®
$200/sqft
$-- HOA
What's special
Spacious lotTile flooring throughout
- 31 days
- 458
- 49
Likely to sell faster than
Zillow last checked:
Listing updated:
Listed by:
Sapir Simply 727-403-0507,
ARC REALTY GROUP 800-636-2080
Source: Stellar MLS,MLS#: TB8553493 Originating MLS: Suncoast Tampa
Facts & features
Interior
Bedrooms & bathrooms
- Bedrooms: 3
- Bathrooms: 1
- Full bathrooms: 1
Primary bedroom
- Features: Walk-In Closet(s)
- Level: First
Kitchen
- Level: First
Living room
- Level: First
Heating
- Central
Cooling
- Central Air
Appliances
- Included: Range, Refrigerator
- Laundry: Inside
Features
- Ceiling Fan(s)
- Flooring: Tile
- Has fireplace: No
Interior area
- Total structure area: 992
- Total interior livable area: 896 sqft
Video & virtual tour
Property
Parking
- Total spaces: 1
- Parking features: Carport
- Carport spaces: 1
Features
- Levels: One
- Stories: 1
- Exterior features: Lighting
Lot
- Size: 4,750 Square Feet
- Dimensions: 50 x 95
Details
- Parcel number: A0829194VK00004500004.0
- Zoning: RM-16
- Special conditions: None
Construction
Type & style
- Home type: SingleFamily
- Property subtype: Single Family Residence
Materials
- Wood Frame
- Foundation: Block
- Roof: Shingle
Condition
- New construction: No
- Year built: 1999
Utilities & green energy
- Sewer: Public Sewer
- Water: Public
- Utilities for property: Electricity Connected, Sewer Connected
Community & HOA
Community
- Pet fee: $0 monthly
- Subdivision: CAMPOBELLO BLOCKS 31 TO 45
HOA
- Has HOA: No
Location
- Region: Tampa
Financial & listing details
- Price per square foot: $200/sqft
- Tax assessed value: $163,750
- Annual tax amount: $3,024
- Date on market: 9/30/2026
- Cumulative days on market: 32 days
- Ownership: Fee Simple
- Total actual rent: 0
- Electric utility on property: Yes
- Road surface type: Asphalt
Estimated market value
$172,100
$163,000 - $181,000
$1,828/mo
Price history
| Date | Event | Price |
|---|---|---|
| 10/13/2026 | Price change | $179,000-5.3%$200/sqft |
Source:  Stellar MLS #TB8553493 Report a problem | ||
| 10/1/2026 | Listed for sale | $189,000+105.4%$211/sqft |
Source: Stellar MLS #TB8553493 Report a problem | ||
| 8/26/2024 | Listing removed | $1,650$2/sqft |
Source: Zillow Rentals Report a problem | ||
| 7/24/2024 | Price change | $1,650-4.3%$2/sqft |
Source: Zillow Rentals Report a problem | ||
| 7/3/2024 | Price change | $1,725-4.2%$2/sqft |
Source: Zillow Rentals Report a problem | ||
| 7/2/2024 | Price change | $1,800-2.7%$2/sqft |
Source: Zillow Rentals Report a problem | ||
| 6/18/2024 | Listed for rent | $1,850+8.8%$2/sqft |
Source: Zillow Rentals Report a problem | ||
| 4/18/2023 | Listing removed | -- |
Source: Zillow Rentals Report a problem | ||
| 4/3/2023 | Price change | $1,700-5.6%$2/sqft |
Source: Zillow Rentals Report a problem | ||
| 3/24/2023 | Listed for rent | $1,800+2.9%$2/sqft |
Source: Zillow Rentals Report a problem | ||
| 11/1/2022 | Listing removed | -- |
Source: Zillow Rental Network_1 Report a problem | ||
| 10/27/2022 | Price change | $1,750-2.8%$2/sqft |
Source: Zillow Rental Network_1 Report a problem | ||
| 10/3/2022 | Listed for rent | $1,800+63.6%$2/sqft |
Source: Zillow Rental Network_1 Report a problem | ||
| 6/13/2018 | Sold | $92,000+84%$103/sqft |
Source: Public Record Report a problem | ||
| 4/19/2018 | Listing removed | $1,100$1/sqft |
Source: Future Home Realty Report a problem | ||
| 4/3/2018 | Listed for rent | $1,100$1/sqft |
Source: Future Home Realty Report a problem | ||
| 3/13/2018 | Sold | $50,000+51.5%$56/sqft |
Source: Public Record Report a problem | ||
| 3/20/2012 | Listing removed | $33,000$37/sqft |
Source: CENTURY 21 Shaw Realty Group #t2495644 Report a problem | ||
| 2/28/2012 | Listed for sale | $33,000$37/sqft |
Source: CENTURY 21 Shaw Realty Group #t2495644 Report a problem | ||
| 12/20/2011 | Listing removed | $33,000$37/sqft |
Source: CENTURY 21 Shaw Realty Group #t2495644 Report a problem | ||
| 11/19/2011 | Listed for sale | $33,000+223.5%$37/sqft |
Source: CENTURY 21 Shaw Realty Group #t2495644 Report a problem | ||
| 4/29/2011 | Sold | $10,200-48.7%$11/sqft |
Source: Public Record Report a problem | ||
| 3/5/2011 | Listed for sale | $19,900-87.2%$22/sqft |
Source: COLDWELL BANKER RESIDENTIAL #T2461058 Report a problem | ||
| 11/28/2006 | Sold | $155,000+24%$173/sqft |
Source: Public Record Report a problem | ||
| 11/5/2005 | Sold | $125,000$140/sqft |
Source: Public Record Report a problem | ||
Public tax history
| Year | Property taxes | Tax assessment |
|---|---|---|
| 2025 | $3,025 +11% | $139,382 +10% |
| 2024 | $2,724 +7.2% | $126,711 +10% |
| 2023 | $2,542 +6% | $115,192 +10% |
| 2022 | $2,399 +15.3% | $104,720 +10% |
| 2021 | $2,081 +14.4% | $95,200 +10% |
| 2020 | $1,818 +8.9% | $86,545 +9.9% |
| 2019 | $1,670 | $78,723 +18% |
| 2018 | $1,670 +115.3% | $66,720 +43.2% |
| 2017 | $776 +23.8% | $46,608 +201.4% |
| 2016 | $627 +12.9% | $15,466 +10% |
| 2015 | $556 +25.6% | $14,060 +10% |
| 2014 | $442 | $12,782 +10% |
| 2013 | $442 +77.3% | $11,620 +10% |
| 2012 | $250 -69.6% | $10,564 -71.5% |
| 2011 | $822 -10.4% | $37,060 -11.3% |
| 2010 | $918 -41.1% | $41,764 -41.4% |
| 2009 | $1,559 -28.4% | $71,256 -28.4% |
| 2008 | $2,179 +4.4% | $99,487 +3.2% |
| 2007 | $2,086 +4% | $96,374 +13.8% |
| 2006 | $2,007 +21.3% | $84,696 +25.3% |
| 2005 | $1,654 | $67,612 +14.2% |
| 2004 | -- | $59,224 +8.6% |
| 2003 | -- | $54,534 -0.6% |
| 2002 | -- | $54,863 +17.9% |
| 2001 | -- | $46,542 +4.3% |
| 2000 | $1,138 | $44,625 |
Find assessor info on the county website
Monthly payment
Est. payment
Payment breakdown
Explore the cost of this home by adjusting the details. Changes won't be saved.Climate risks
Neighborhood: North Ybor

Similar homes
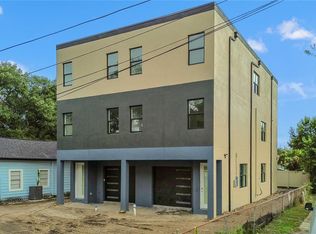
- $175,0003 bd1 ba936 sqft2911 N 24TH STREET, TAMPA, FL 33605For Sale

 MLS ID #TB8551623, Sapir Simply, ARC REALTY GROUP. Stellar MLS
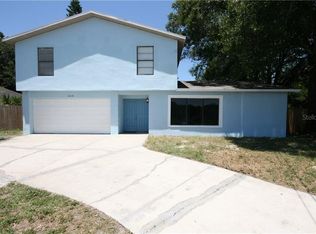
- $180,0003 bd1 ba1.3k sqft(Undisclosed Address), TAMPA, FL 33605For Sale
 MLS ID #TB8503790, Marcus Scott, SCOTT & FAULK INTERVEST REALTY. Stellar MLS
- $189,0003 bd2 ba1.1k sqft3308 E CHELSEA STREET, TAMPA, FL 33610For Sale
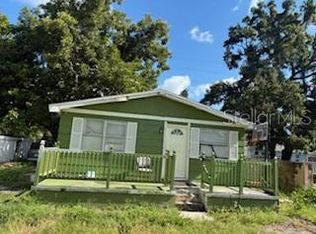 MLS ID #G5118659, Brett Garcia, LPT REALTY, LLC. Stellar MLS
- $220,0003 bd2 ba840 sqft3403 MACHADO STREET, TAMPA, FL 33605For Sale
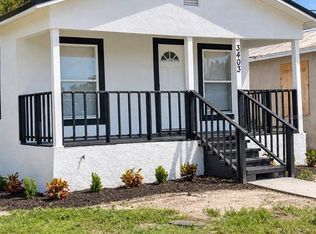 MLS ID #TB8548712, Nesly Eliscart, PROPERTY SCHOLARS REALTY & DEV. Stellar MLS
- $219,9003 bd2 ba912 sqft2709 E 15TH AVENUE, TAMPA, FL 33605For SaleMLS ID #TB8555773, Bradley Chais, KELLER WILLIAMS TAMPA CENTRAL. Stellar MLS
- $210,0003 bd1 ba1k sqft3008 N 43RD STREET, TAMPA, FL 33605For SaleMLS ID #O6426598, Raquel Littlejohn, MAINSTAY BROKERAGE LLC. Stellar MLS
- $245,0003 bd1 ba924 sqft2711 E 25TH AVENUE, TAMPA, FL 33605For SaleMLS ID #TB8426758, Correy Smith, KELLER WILLIAMS SOUTH TAMPA. Stellar MLS
- $185,0003 bd1 ba704 sqft3103 E EMMA STREET, TAMPA, FL 33610For SaleMLS ID #TB8550824, Adrian Castillo, LLC, ORCHARD BROKERAGE, LLC. Stellar MLS
- $200,0001 bd1 ba1k sqft2010 E PALM AVENUE #14217, TAMPA, FL 33605For SaleMLS ID #TB8562907, Amy M. Storch, SELLSTATE COASTAL REALTY. Stellar MLS
- $215,0002 bd1 ba732 sqft2410 E COLUMBUS DRIVE, TAMPA, FL 33605For SaleMLS ID #TB8543849, Destiny Rodriguez, KELLER WILLIAMS ST PETE REALTY. Stellar MLS
- $184,9002 bd2 ba1k sqft1401 E 24TH AVENUE, TAMPA, FL 33605For SaleMLS ID #G5116452, Brett Garcia, LPT REALTY, LLC. Stellar MLS
- $181,9002 bd1 ba867 sqft1810 E PALM AVENUE #5114, TAMPA, FL 33605For SaleMLS ID #TB8510216, Matt Generose, THE SOMERDAY GROUP PL. Stellar MLS
- $169,9002 bd1 ba672 sqft3721 E IDLEWILD AVENUE, TAMPA, FL 33610For SaleMLS ID #TB8561347, Cris Zuniga, FIDATA REAL ESTATE LLC. Stellar MLS
- $254,9903 bd1 ba1k sqft2312 E 23RD AVENUE, TAMPA, FL 33605For SaleMLS ID #TB8547609, Thomas Flannery, MCBRIDE KELLY & ASSOCIATES. Stellar MLS
- $169,0003 bd2 ba1.2k sqftArlington Heights, Tampa, FL 33603Auction
 MLS ID #A12106977, Alexandra Vorbe, Vorbe Gonzalez RE Management LLC. MIAMI
- $225,0003 bd2 ba1.2k sqft3107 N 16TH STREET, TAMPA, FL 33605For SaleMLS ID #O6417110, Raquel Littlejohn, MAINSTAY BROKERAGE LLC. Stellar MLS
- $179,9001 bd1 ba1k sqft2010 E PALM AVENUE #14320, TAMPA, FL 33605For SaleMLS ID #TB8542687, Rudi Ramnanan, COMPASS FLORIDA LLC. Stellar MLS
- $215,0002 bd1 ba1k sqft3511 E 23RD AVENUE, TAMPA, FL 33605For SaleMLS ID #TB8516232, Ruddy Hostia LLC, CENTURY 21 ELITE LOCATIONS, INC. Stellar MLS
- $189,0003 bd1 ba824 sqft3404 E 33RD AVENUE, TAMPA, FL 33610For SaleMLS ID #L4958834, Kristin Kellin, KELLER WILLIAMS REALTY. Stellar MLS
