Your dream home awaits! This beautifully renovated 3-bedroom, 2-bath home offers high-end finishes, an open layout, and plenty of windows that flood the interior with natural light. You'll notice the chef's kitchen with new stainless-steel appliances. The home features LVP flooring, modern lighting fixtures, and fenced yards at the front and back for privacy and outdoor enjoyment. There's space to park your RV under the detached carport, plus a spacious backyard shed perfect for storage or a workshop. Act quickly—this opportunity can be yours! Recent updates include a new garage door and opener in 2022 and a new HVAC system installed in 2020.
Active
Price cut: $22K (10/23)
$338,000
357 DILLON Drive, Orange Park, FL 32073
3beds
1,725sqft
Single Family Residence
Built in 1974
0.35 Acres Lot
$335,000 Zestimate®
$196/sqft
$-- HOA
What's special
Modern lighting fixturesHigh-end finishesOpen layoutLvp flooring
- 23 days
- 312
- 45
Likely to sell faster than
Zillow last checked:
Listing updated:
Listed by:
JEAN B BREVAL 904-360-9761,
CASSEUS REALTY CORP 904-568-5032
Source: realMLS,MLS#: 2168541
Facts & features
Interior
Bedrooms & bathrooms
- Bedrooms: 3
- Bathrooms: 2
- Full bathrooms: 2
Heating
- Central, Electric
Cooling
- Central Air, Electric
Appliances
- Included: Convection Oven, Dishwasher, Electric Oven, Electric Range, Electric Water Heater, Ice Maker, Microwave, Refrigerator
Interior area
- Total interior livable area: 1,725 sqft
Property
Parking
- Total spaces: 2
- Parking features: Additional Parking
- Garage spaces: 2
Features
- Stories: 1
Lot
- Size: 0.35 Acres
Details
- Parcel number: 01042501271200000
Construction
Type & style
- Home type: SingleFamily
- Property subtype: Single Family Residence
Condition
- New construction: No
- Year built: 1974
Utilities & green energy
- Water: Public
- Utilities for property: Cable Available, Electricity Connected, Sewer Connected, Water Connected
Community & HOA
Community
- Subdivision: Bellair West
HOA
- Has HOA: No
Location
- Region: Orange Park
Financial & listing details
- Price per square foot: $196/sqft
- Tax assessed value: $315,317
- Annual tax amount: $4,444
- Date on market: 10/9/2026
- Listing terms: Cash,Conventional,FHA,VA Loan
Estimated market value
$335,000
$318,000 - $352,000
$1,933/mo
Price history
| Date | Event | Price |
|---|---|---|
| 10/23/2026 | Price change | $338,000-6.1%$196/sqft |
Source:  realMLS #2168541 Report a problem | ||
| 10/9/2026 | Listed for sale | $360,000-1.4%$209/sqft |
Source: realMLS #2168541 Report a problem | ||
| 12/21/2022 | Sold | $365,000+1.4%$212/sqft |
Source: Public Record Report a problem | ||
| 8/25/2022 | Pending sale | $359,900$209/sqft |
Source: realMLS #1172922 Report a problem | ||
| 8/9/2022 | Contingent | $359,900$209/sqft |
Source: realMLS #1172922 Report a problem | ||
| 7/27/2022 | Price change | $359,900-2.7%$209/sqft |
Source: realMLS #1172922 Report a problem | ||
| 7/19/2022 | Price change | $369,900-1.3%$214/sqft |
Source: realMLS #1172922 Report a problem | ||
| 6/30/2022 | Price change | $374,900-1.2%$217/sqft |
Source: realMLS #1172922 Report a problem | ||
| 6/24/2022 | Price change | $379,500-0.1%$220/sqft |
Source: realMLS #1172922 Report a problem | ||
| 6/16/2022 | Listed for sale | $379,900$220/sqft |
Source: realMLS #1172922 Report a problem | ||
| 6/5/2022 | Pending sale | $379,900$220/sqft |
Source: realMLS #1172922 Report a problem | ||
| 6/3/2022 | Listed for sale | $379,900+63.4%$220/sqft |
Source: realMLS #1172922 Report a problem | ||
| 3/11/2022 | Sold | $232,500+3.3%$135/sqft |
Source: realMLS #1156091 Report a problem | ||
| 3/4/2022 | Pending sale | $225,000$130/sqft |
Source: realMLS #1156091 Report a problem | ||
| 3/2/2022 | Contingent | $225,000$130/sqft |
Source: realMLS #1156091 Report a problem | ||
| 3/1/2022 | Listed for sale | $225,000+47.1%$130/sqft |
Source: realMLS #1156091 Report a problem | ||
| 7/22/2005 | Sold | $153,000+53.2%$89/sqft |
Source: Public Record Report a problem | ||
| 3/1/2001 | Sold | $99,900$58/sqft |
Source: Public Record Report a problem | ||
Public tax history
| Year | Property taxes | Tax assessment |
|---|---|---|
| 2025 | -- | $308,043 +2.9% |
| 2024 | $4,258 +2.8% | $299,362 +2.9% |
| 2023 | $4,143 +48.9% | $290,994 +61% |
| 2022 | $2,782 +11.4% | $180,759 +23.9% |
| 2021 | $2,498 +9.7% | $145,861 +8.3% |
| 2020 | $2,276 | $134,704 +2.7% |
| 2019 | $2,276 +1.4% | $131,163 +3.8% |
| 2018 | $2,245 +12.4% | $126,365 +15.5% |
| 2017 | $1,998 +9.1% | $109,421 +7.2% |
| 2016 | $1,832 +4.3% | $102,029 +4.5% |
| 2015 | $1,757 +0.5% | $97,658 +4.7% |
| 2014 | $1,748 | $93,282 +4.2% |
| 2013 | -- | $89,512 +1.8% |
| 2012 | -- | $87,914 -4.6% |
| 2011 | -- | $92,181 -5.5% |
| 2010 | -- | $97,594 -14% |
| 2009 | -- | $113,542 -9.9% |
| 2008 | -- | $126,029 -8.9% |
| 2007 | -- | $138,373 +5.7% |
| 2006 | -- | $130,863 +22.1% |
| 2005 | -- | $107,190 +8.7% |
| 2004 | -- | $98,583 +13.2% |
| 2003 | -- | $87,092 +23% |
| 2001 | -- | $70,806 +3% |
| 2000 | -- | $68,744 |
Find assessor info on the county website
Monthly payment
Est. payment
Payment breakdown
Explore the cost of this home by adjusting the details. Changes won't be saved.Climate risks
Neighborhood: 32073


Similar homes
- $320,0004 bd2 ba1.6k sqft391 BLAIRMORE Boulevard W, Orange Park, FL 32073For Sale
 MLS ID #2166100, THIDA MAO. realMLS
- $340,0003 bd3 ba1.9k sqft55 PREAKNESS Plaza, Orange Park, FL 32073For Sale
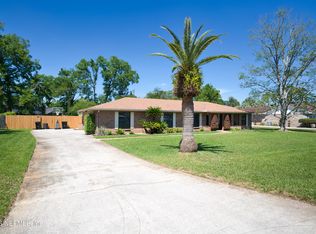 MLS ID #2168619, SHIQI (THOMAS) ZHANG. realMLS
- $274,9003 bd2 ba1.3k sqft159 CAPELLA Road, Orange Park, FL 32073For Sale
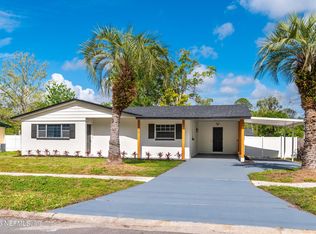 MLS ID #2171149, XHOANA GAVOCI. realMLS
- $373,0003 bd3 ba2k sqft287 GLENEAGLES Drive, Orange Park, FL 32073For Sale
 MLS ID #2165910, KAITLIN CHERNYSHOV. realMLS
