Recently updated 3 bedroom, 2.5 bath home with master suite and swimming pool. Conveniently located within walking distance to water access, restaurants and public transportation. - Just listed with more pictures to follow.
Yard and pool maintenance included.
Pre-foreclosure
Est. $651,600
409 87th Ave, Saint Pete Beach, FL 33706
3beds
2baths
1,800sqft
SingleFamily
Built in 1956
7,405 Square Feet Lot
$651,600 Zestimate®
$362/sqft
$-- HOA
Overview
- 195 days
- 13
- 0
Facts & features
Interior
Bedrooms & bathrooms
- Bedrooms: 3
- Bathrooms: 2.5
Heating
- Forced air
Cooling
- Other
Appliances
- Included: Dryer, Washer
- Laundry: In Unit
Features
- Flooring: Hardwood
Interior area
- Total interior livable area: 1,800 sqft
Property
Parking
- Parking features: Garage - Detached
Features
- Exterior features: Stucco
- View description: None
Lot
- Size: 7,405 Square Feet
Details
- Parcel number: 253115782641060020
Construction
Type & style
- Home type: SingleFamily
Materials
- masonry
- Foundation: Footing
- Roof: Composition
Condition
- Year built: 1956
Community & HOA
Location
- Region: Saint Pete Beach
Financial & listing details
- Price per square foot: $362/sqft
- Tax assessed value: $391,723
- Annual tax amount: $5,743
Foreclosure details
Estimated market value
$651,600
$593,000 - $717,000
$5,363/mo
Price history
| Date | Event | Price |
|---|---|---|
| 7/28/2023 | Sold | $695,000-0.7%$386/sqft |
Source: Public Record Report a problem | ||
| 6/27/2023 | Pending sale | $699,999$389/sqft |
Source:  Stellar MLS #T3440733 Report a problem | ||
| 6/22/2023 | Price change | $699,999-6.7%$389/sqft |
Source: Stellar MLS #T3440733 Report a problem | ||
| 6/9/2023 | Price change | $750,000-1.3%$417/sqft |
Source: Stellar MLS #T3440733 Report a problem | ||
| 6/1/2023 | Listed for sale | $759,990-1.2%$422/sqft |
Source: Stellar MLS #T3440733 Report a problem | ||
| 5/10/2023 | Listing removed | -- |
Source: Stellar MLS #T3440733 Report a problem | ||
| 5/3/2023 | Price change | $769,000-1.3%$427/sqft |
Source: Stellar MLS #T3440733 Report a problem | ||
| 4/20/2023 | Listed for sale | $779,000+1582.5%$433/sqft |
Source: Stellar MLS #T3440733 Report a problem | ||
| 3/25/2022 | Listing removed | -- |
Source: Zillow Rental Manager Report a problem | ||
| 3/7/2022 | Price change | $3,500+6.1%$2/sqft |
Source: Zillow Rental Manager Report a problem | ||
| 2/23/2022 | Listed for rent | $3,300$2/sqft |
Source: Zillow Rental Manager Report a problem | ||
| 6/10/2009 | Sold | $46,300-70.6%$26/sqft |
Source: Public Record Report a problem | ||
| 10/12/2001 | Sold | $157,500$88/sqft |
Source: Public Record Report a problem | ||
Public tax history
| Year | Property taxes | Tax assessment |
|---|---|---|
| 2025 | $5,743 -30.8% | $391,723 -30.9% |
| 2024 | $8,296 +13.9% | $566,660 +49.1% |
| 2023 | $7,286 +15.5% | $379,997 +10% |
| 2022 | $6,307 +12.3% | $345,452 +10% |
| 2021 | $5,618 +11.3% | $314,047 +9.8% |
| 2020 | $5,047 +1.1% | $286,084 +2.4% |
| 2019 | $4,993 | $279,319 +4.3% |
| 2018 | $4,993 +7.1% | $267,693 +10.8% |
| 2017 | $4,663 +17% | $241,591 +9.5% |
| 2016 | $3,986 +28% | $220,667 +30.5% |
| 2015 | $3,115 +8.9% | $169,043 +6.9% |
| 2014 | $2,861 +11.8% | $158,124 +14.5% |
| 2013 | $2,559 +9.4% | $138,127 +16.2% |
| 2012 | $2,339 | $118,827 -11.5% |
| 2011 | -- | $134,318 -1.3% |
| 2010 | -- | $136,108 -14.6% |
| 2009 | -- | $159,392 -25% |
| 2008 | $3,724 | $212,600 -11.9% |
| 2007 | -- | $241,300 +11.1% |
| 2005 | -- | $217,200 +33.3% |
| 2004 | $2,425 +1.6% | $163,000 +11.6% |
| 2003 | $2,386 +109.5% | $146,100 +3.8% |
| 2002 | $1,139 | $140,800 +32.8% |
| 2001 | $1,139 +4.9% | $106,000 +8.5% |
| 2000 | $1,086 | $97,700 |
Find assessor info on the county website
Monthly payment
Climate risks
Neighborhood: 33706
- $--3 bd2 ba-- sqft409 87th Ave, Saint Petersburg, FL 33706Off Market
- $1,150,000-- bd-- ba3.5k sqft8700 Blind Pass Rd, Saint Petersburg, FL 33706Off Market
- $356,800-- bd1 ba972 sqft420 87th Ave, Saint Pete Beach, FL 33706Off Market
- $618,7004 bd5 ba2.6k sqft402 88th Ave, Saint Pete Beach, FL 33706Off Market
Similar homes
- $649,0003 bd3 ba1.8k sqft424 88TH AVENUE, ST PETE BEACH, FL 33706For Sale
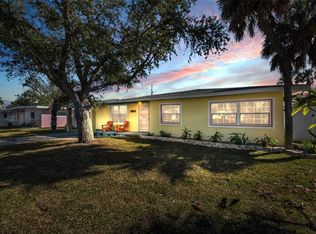
 MLS ID #W7880901, Jennifer Tobey, PA, RE/MAX CHAMPIONS. Stellar MLS
- $599,9993 bd2 ba1.3k sqft490 82ND AVENUE, ST PETE BEACH, FL 33706For Sale
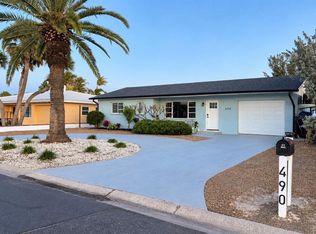 MLS ID #TB8558533, Jennifer Franco, STAR BAY REALTY CORP.. Stellar MLS
- $559,9003 bd2 ba1.5k sqft406 88TH AVENUE, ST PETE BEACH, FL 33706For Sale
 MLS ID #A4703113, Michelle Jones, CENTURY 21 ROSEBAY. Stellar MLS
- $739,9003 bd2 ba1.4k sqft455 81ST AVENUE, ST PETE BEACH, FL 33706For Sale
 MLS ID #TB8540099, Brandon Tecklenburg, EXP REALTY. Stellar MLS
- $550,0002 bd2 ba1.1k sqft8175 GULF BOULEVARD, ST PETE BEACH, FL 33706For SaleMLS ID #TB8560453, Susan Colby, DALTON WADE INC. Stellar MLS
- $505,0003 bd2 ba1.2k sqft440 89TH AVENUE, ST PETE BEACH, FL 33706For SaleMLS ID #TB8537114, Sandra Munoz, CHARLES RUTENBERG REALTY INC. Stellar MLS
- $599,0002 bd1 ba1.1k sqft535 78TH AVENUE, ST PETERSBURG, FL 33706For SaleMLS ID #TB8524407, Stephen Hachey, FLAT FEE MLS REALTY. Stellar MLS
- $695,0003 bd2 ba1.8k sqft10001 S YACHT CLUB DRIVE, TREASURE ISLAND, FL 33706For SaleMLS ID #W7888826, ALEXIS Selby, INVESTMENT FLORIDA REALTY LLC. Stellar MLS
- $699,0003 bd3 ba1k sqft115 90TH AVENUE, TREASURE ISLAND, FL 33706For SaleMLS ID #TB8557536, Hendrik Bisanz, SEASALT PROPERTIES. Stellar MLS
- $528,0003 bd1 ba1k sqft434 79TH AVENUE, ST PETE BEACH, FL 33706For SaleMLS ID #O6447678, Steven Koleno, BEYCOME OF FLORIDA LLC. Stellar MLS
- $729,0003 bd3 ba1.8k sqft9158 BLIND PASS ROAD, ST PETE BEACH, FL 33706For SaleMLS ID #TB8554009, Jennifer Thayer, KELLER WILLIAMS ST PETE REALTY. Stellar MLS
- $449,0003 bd2 ba1.4k sqft540 80TH AVENUE, ST PETE BEACH, FL 33706For SaleMLS ID #TB8552852, Jennifer Orns, COMPASS FLORIDA LLC. Stellar MLS
- $799,0003 bd3 ba1.4k sqft120 93RD AVENUE, TREASURE ISLAND, FL 33706For SaleMLS ID #TB8543354, Kendra Fountain, COASTAL PROPERTIES GROUP INTERNATIONAL. Stellar MLS
- $499,0003 bd2 ba1.2k sqft510 79TH AVENUE, ST PETE BEACH, FL 33706For SaleMLS ID #TB8478040, Justin Smith, SMITH & ASSOCIATES REAL ESTATE. Stellar MLS
- $649,0003 bd2 ba1.3k sqft7932 SAILBOAT KEY BOULEVARD S #101, SOUTH PASADENA, FL 33707For SaleMLS ID #TB8497954, John Fullerton, COASTAL PROPERTIES GROUP. Stellar MLS
- $559,9002 bd3 ba1k sqft9901 1ST STREET E #A, TREASURE ISLAND, FL 33706For SaleMLS ID #TB8562526, Jill Helgren, COASTAL PROPERTIES GROUP. Stellar MLS
- $575,0002 bd2 ba1.1k sqft340 79TH AVENUE, ST PETE BEACH, FL 33706For SaleMLS ID #TB8437260, Harris Gruman, REALNET FLORIDA REAL ESTATE. Stellar MLS
- $475,0003 bd2 ba1.4k sqft504 79TH AVENUE, ST PETE BEACH, FL 33706For SaleMLS ID #TB8527591, Troy Walseth, KELLER WILLIAMS GULF BEACHES. Stellar MLS
- $699,9993 bd3 ba2k sqft9215 CAPTIVA CIRCLE, ST PETE BEACH, FL 33706For SaleMLS ID #TB8467564, Shawna Kugler, EZ CHOICE MLS, INC. Stellar MLS
- $489,9992 bd2 ba1k sqft550 80TH AVENUE, ST PETE BEACH, FL 33706For SaleMLS ID #TB8556619, Keith Flanagan, EXP REALTY LLC. Stellar MLS
