FANTASTIC NORTH CAPTIVA ISLAND BUILDING OPPORTUNITY – C-1 ZONED, CLEARED & READY! Build your island retreat on beautiful North Captiva Island, a natural barrier island accessible only by boat or private aircraft, with no bridges or traditional automobile traffic. Golf carts, bicycles, and walking are the preferred ways to explore, while approximately half of the island is preserved as state park land, helping maintain its natural beauty and uncrowded atmosphere.
This cleared building lot features C-1 zoning, a Lee County commercial classification allowing certain commercial and select residential uses, providing added flexibility for future development. Buyers should verify their intended use with Lee County.
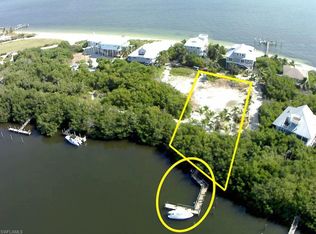
Located in a quieter peninsula setting, the property offers the potential for INCREDIBLE water views of Pine Island Sound to the east and harbor views to the west! An elevated home with upper-level balconies or a lookout could take advantage of the surrounding views. Imagine enjoying colorful island sunrises and sunsets from your future balconies or private lookout!
The property also includes a paid local electric participation fee and recorded shared well rights to a well on an adjacent property, providing valuable existing infrastructure for future construction.
Opportunities like this on North Captiva are limited—inquire today and explore the possibilities! Please reference the fenced lot shown in the listing photos.
Active
$285,000
4341 Sol Vista Dr, Upper Captiva, FL 33924
--beds
--baths
9,060Square Feet
Unimproved Land
Built in ----
9,060 Square Feet Lot
$-- Zestimate®
$--/sqft
$-- HOA
What's special
Quieter peninsula setting
- 26 days
- 117
- 13
Zillow last checked:
Listing updated:
Listed by:
Amy Ivey 239-462-9614,
Swept Away Realty
Source: Florida Gulf Coast MLS,MLS#: 2026042210 Originating MLS: Florida Gulf Coast
Facts & features
Interior
Cooling
- See Remarks
Video & virtual tour
Property
Features
- Fencing: Fenced
- Has view: Yes
- View description: Bay, Landscaped, Mangroves, Partial, Trees/Woods
- Has water view: Yes
- Water view: Bay
- Waterfront features: None
Lot
- Size: 9,060 Square Feet
- Dimensions: 81 x 115 x 80 x 115
- Features: Rectangular Lot
- Residential vegetation: See Remarks
Details
- Parcel number: 0445211500000.0110
- Lease amount: $0
- Zoning description: C-1
Utilities & green energy
- Sewer: None
- Water: None
- Utilities for property: Other, Sewer Not Available, Water Not Available
Community & HOA
Community
- Features: Boat Facilities
- Condo and coop fee: $0
- Membership fee: $0
- Subdivision: JOSE'S HIDEAWAY
HOA
- Services included: None
Location
- Region: Upper Captiva
Financial & listing details
- Tax assessed value: $405,477
- Annual tax amount: $5,945
- Date on market: 10/7/2026
- Listing terms: All Financing Considered,Cash
- Road surface type: Dirt
Estimated market value
Not available
Estimated sales range
Not available
Not available
Price history
| Date | Event | Price |
|---|---|---|
| 10/7/2026 | Listed for sale | $285,000+5.9% |
Source:  Florida Gulf Coast MLS #2026042210 Report a problem | ||
| 2/28/2023 | Sold | $269,000-10% |
Source: Florida Gulf Coast MLS #222046762 Report a problem | ||
| 2/13/2023 | Pending sale | $299,000 |
Source:  Florida Gulf Coast MLS #222046762 Report a problem | ||
| 6/24/2022 | Price change | $299,000-6.3% |
Source: Florida Gulf Coast MLS #222046762 Report a problem | ||
| 2/17/2022 | Price change | $319,000-8.9% |
Source:  HCMLS #2221705 Report a problem | ||
| 1/9/2022 | Listed for sale | $350,000 |
Source: HCMLS #2221705 Report a problem | ||
| 12/27/2021 | Pending sale | $350,000 |
Source:  Stellar MLS #W7837181 Report a problem | ||
| 10/28/2021 | Price change | $350,000-12.5% |
Source: Stellar MLS #W7837181 Report a problem | ||
| 8/22/2021 | Listed for sale | $400,000+33.3% |
Source: Stellar MLS #W7837181 Report a problem | ||
| 7/20/2021 | Listing removed | -- |
Source: Florida Gulf Coast MLS #221018304 Report a problem | ||
| 3/10/2021 | Listed for sale | $300,000+200% |
Source: Florida Gulf Coast MLS #221018304 Report a problem | ||
| 12/11/1996 | Sold | $100,000 |
Source: Public Record Report a problem | ||
Public tax history
| Year | Property taxes | Tax assessment |
|---|---|---|
| 2025 | $5,945 -1% | $405,477 -1.9% |
| 2024 | $6,006 +51.4% | $413,478 +750.2% |
| 2023 | $3,966 +80.6% | $48,631 +10% |
| 2022 | $2,195 +33.4% | $44,210 +10% |
| 2021 | $1,646 +0.1% | $40,191 +10% |
| 2020 | $1,645 +2.1% | $36,537 -79.7% |
| 2019 | $1,610 | $180,000 |
| 2018 | $1,610 -2.5% | $180,000 -43.4% |
| 2017 | $1,652 -72.4% | $318,150 +11.6% |
| 2016 | $5,991 +7.9% | $285,206 -5% |
| 2015 | $5,553 -4.5% | $300,197 +15.1% |
| 2014 | $5,815 +27.1% | $260,899 -30.2% |
| 2013 | $4,576 -35.1% | $373,520 -7.3% |
| 2012 | $7,047 +8.5% | $402,831 +6.6% |
| 2011 | $6,496 -1.4% | $377,848 -0.3% |
| 2010 | $6,592 -3.3% | $379,087 -5.5% |
| 2009 | $6,816 +1.4% | $401,260 -3.7% |
| 2007 | $6,719 +13.1% | $416,770 +18.5% |
| 2006 | $5,941 +11.5% | $351,730 +21.6% |
| 2004 | $5,326 +18.7% | $289,140 +23.7% |
| 2003 | $4,486 -0.7% | $233,670 +0% |
| 2002 | $4,516 | $233,640 +15.5% |
| 2000 | -- | $202,210 |
Find assessor info on the county website
Monthly payment
Est. payment
Payment breakdown
Explore the cost of this home by adjusting the details. Changes won't be saved.Climate risks
Neighborhood: 33924
Similar homes
- $225,0007,579 sqft4486 Hammock Ct, Captiva, FL 33924Lot/Land
 MLS ID #2026037664, Amy Ivey, Swept Away Realty. Florida Gulf Coast MLS
- $245,00010,498 sqft4621 ORO PESOS LANE LOT 1, CAPTIVA, FL 33924Lot/Land

 MLS ID #TB8311010, Angela Crook, HIGH POINT REALTY INC. Stellar MLS
- $250,0008,624 sqft200 Mourning Dove Dr, Captiva, FL 33924New Construction
 MLS ID #224021960, Rhonda Milligan, The Keyes Company. Florida Gulf Coast MLS
- $250,0009,408 sqft210 Mourning Dove Dr, Captiva, FL 33924New ConstructionMLS ID #224021961, Rhonda Milligan, The Keyes Company. Florida Gulf Coast MLS
- $170,00010,497 sqft4521 Oro Pesos Ln, Captiva, FL 33924Lot/LandMLS ID #2026013740, Dave Watt, LoKation. Florida Gulf Coast MLS
- $389,00010,497 sqft4601 Oro Pesos Ln, Captiva, FL 33924Lot/LandMLS ID #2026025092, Mark Muller, Resort Properties Internationa. Florida Gulf Coast MLS
- $295,0000.44 acres141 Mourning Dove Dr, Captiva, FL 33924Lot/LandMLS ID #2025020953, Mark Muller, Resort Properties Internationa. Florida Gulf Coast MLS
- $199,0000.36 acres12541 S Banks Dr, Captiva, FL 33924Lot/LandMLS ID #2026004719, Josh Stewart, RE/MAX Realty Team. Florida Gulf Coast MLS
- $255,0001.1 acresACCESS UNDETERMINED LOT 7, BOKEELIA, FL 33922Lot/LandMLS ID #C7458551, Sage Andress, SUNMARK REALTY. Stellar MLS
- $285,000-- sqftBoat Slip Upper #3, Captiva, FL 33924Lot/LandMLS ID #2026006617, Mark Muller, Resort Properties Internationa. Florida Gulf Coast MLS
- $225,0000.33 acres5414 Martin Cv, Bokeelia, FL 33922Lot/LandMLS ID #2025009853, Becky White, EXP Realty LLC. Florida Gulf Coast MLS
- $275,00010,018 sqft1239 NW 39th Ave, Cape Coral, FL 33993Lot/LandMLS ID #2026041424, Jay Garick, Adnoram Realty Corp. Florida Gulf Coast MLS
- $239,0002.52 acres4159 SUNSHINE BOULEVARD LOT 6, ST JAMES CITY, FL 33956Lot/LandMLS ID #C7523454, Nelson Rua, JOHN R. WOOD PROPERTIES. Stellar MLS
- $239,0002.52 acres4159 Sunshine Blvd, Saint James City, FL 33956Lot/LandMLS ID #2025026389, Nelson Rua, John R. Wood Properties. Florida Gulf Coast MLS
- $275,00010,018 sqft4208 SW 5th Ave, Cape Coral, FL 33914Lot/LandMLS ID #2026043266, Heiko Strauss, Century 21 AllPoints Realty. Florida Gulf Coast MLS
- $300,0009,234 sqft3200 Stabile RD, ST. JAMES CITY, FL 33956Lot/Land
 MLS ID #226037663, Aaron Wolf, PA, John R Wood Properties. SWFLMLS
- $379,00010,018 sqft4000 SW 26th Ave, Cape Coral, FL 33914Lot/LandMLS ID #2026021607, Adrian Waring, Priceless Realty, Inc.. Florida Gulf Coast MLS
- $185,0007,187 sqft5150 Sandpiper Dr, Saint James City, FL 33956Lot/LandMLS ID #2025004573, John Faulkner, Century 21 Sunbelt Realty. Florida Gulf Coast MLS
- $240,0000.33 acres5127 Curlew Dr, Saint James City, FL 33956Lot/LandMLS ID #2026035960, Monty Sinnamon, DomainRealty.com LLC. Florida Gulf Coast MLS
- $275,00010,018 sqft400 NW 32nd Pl, Cape Coral, FL 33993Lot/LandMLS ID #2026015421, Kenneth Doran, EXIT Gulf Coast Realty. Florida Gulf Coast MLS
