This 1323 square foot single family home has 4 bedrooms and 2.0 bathrooms. This home is located at 510 Falcon Dr, Vallejo, CA 94589.
Pre-foreclosure
Street View
Est. $509,200
510 Falcon Dr, Vallejo, CA 94589
4beds
1,323sqft
SingleFamily
Built in 1965
6,098 Square Feet Lot
$509,200 Zestimate®
$385/sqft
$-- HOA
Overview
- 115 days
- 11
- 0
Facts & features
Interior
Bedrooms & bathrooms
- Bedrooms: 4
- Bathrooms: 2
- Full bathrooms: 2
Heating
- Other
Cooling
- Central
Appliances
- Included: Dishwasher, Garbage disposal
Features
- Has fireplace: Yes
Interior area
- Total interior livable area: 1,323 sqft
Property
Parking
- Total spaces: 1
- Parking features: Garage - Attached
Features
- Exterior features: Vinyl
Lot
- Size: 6,098 Square Feet
Details
- Parcel number: 0068062240
Construction
Type & style
- Home type: SingleFamily
Materials
- Roof: Composition
Condition
- Year built: 1965
Community & HOA
Location
- Region: Vallejo
Financial & listing details
- Price per square foot: $385/sqft
- Tax assessed value: $546,516
Foreclosure details
Estimated market value
$509,200
$484,000 - $535,000
$2,909/mo
Price history
| Date | Event | Price |
|---|---|---|
| 6/8/2021 | Sold | $495,000+3.1%$374/sqft |
Source:  BAREIS #321018966 Report a problem | ||
| 4/8/2021 | Pending sale | $480,000$363/sqft |
Source: BAREIS #321018966 Report a problem | ||
| 3/29/2021 | Listed for sale | $480,000+25.2%$363/sqft |
Source: BAREIS #321018966 Report a problem | ||
| 6/19/2020 | Sold | $383,500+1.2%$290/sqft |
Source: Public Record Report a problem | ||
| 5/9/2020 | Pending sale | $379,000$286/sqft |
Source: RE/MAX Gold-Vallejo #22009385 Report a problem | ||
| 5/3/2020 | Listed for sale | $379,000+279%$286/sqft |
Source: RE/MAX Gold-Vallejo #22009385 Report a problem | ||
| 9/18/2015 | Listing removed | $1,675$1/sqft |
Source: Real Property Management Report a problem | ||
| 9/10/2015 | Listed for rent | $1,675+24.1%$1/sqft |
Source: Real Property Management Select Report a problem | ||
| 6/22/2013 | Listing removed | $1,350$1/sqft |
Source: RPM Select Report a problem | ||
| 6/7/2013 | Listed for rent | $1,350$1/sqft |
Source: Real Property Management Select Report a problem | ||
| 4/13/2012 | Listing removed | $1,350-3.6%$1/sqft |
Source: Real Property Management Select Report a problem | ||
| 3/30/2012 | Price change | $1,400-3.4%$1/sqft |
Source: Real Property Management Select Report a problem | ||
| 3/17/2012 | Listed for rent | $1,450$1/sqft |
Source: Rentbits Report a problem | ||
| 2/10/2012 | Sold | $100,000-13%$76/sqft |
Source: Public Record Report a problem | ||
| 10/21/2011 | Listed for sale | $114,900$87/sqft |
Source: foreclosure.com Report a problem | ||
| 7/19/2011 | Listing removed | $114,900$87/sqft |
Source: foreclosure.com Report a problem | ||
| 7/12/2011 | Listed for sale | $114,900-28.1%$87/sqft |
Source: foreclosure.com Report a problem | ||
| 4/28/2011 | Listing removed | $159,900$121/sqft |
Source: foreclosure.com Report a problem | ||
| 4/23/2011 | Listed for sale | $159,900+52.3%$121/sqft |
Source: foreclosure.com Report a problem | ||
| 4/6/2011 | Sold | $105,000-16%$79/sqft |
Source: Public Record Report a problem | ||
| 1/29/1999 | Sold | $125,000$94/sqft |
Source: Public Record Report a problem | ||
Public tax history
| Year | Property taxes | Tax assessment |
|---|---|---|
| 2026 | -- | $546,516 +2% |
| 2025 | $8,288 +11.5% | $535,801 +2% |
| 2024 | $7,435 +11.9% | $525,296 +2% |
| 2023 | $6,647 +1.1% | $514,997 +2% |
| 2022 | $6,571 +26.4% | $504,900 +30.3% |
| 2021 | $5,198 +140.5% | $387,472 +237.7% |
| 2020 | $2,161 +4.1% | $114,729 +2% |
| 2019 | $2,076 +7.6% | $112,480 +2% |
| 2018 | $1,930 -62% | $110,276 +2% |
| 2017 | $5,083 +265.6% | $108,115 +2% |
| 2016 | $1,390 +12.4% | $105,996 +1.5% |
| 2015 | $1,237 +1.4% | $104,405 +2% |
| 2014 | $1,220 | $102,361 +0.5% |
| 2013 | -- | $101,898 +2% |
| 2012 | -- | $99,900 -11.6% |
| 2011 | -- | $113,000 -18.7% |
| 2010 | -- | $139,000 |
| 2009 | -- | $139,000 -6.8% |
| 2008 | -- | $149,192 +2% |
| 2007 | -- | $146,267 +2% |
| 2006 | -- | $143,399 +2% |
| 2005 | -- | $140,587 +2% |
| 2004 | -- | $137,830 +1.9% |
| 2003 | -- | $135,304 +2% |
| 2002 | -- | $132,651 +2% |
| 2001 | -- | $130,050 +2% |
| 2000 | $1,385 | $127,500 |
Find assessor info on the county website
Monthly payment
Climate risks
Neighborhood: Madigan


Similar homes
- $499,9503 bd2 ba1.1k sqft218 Princeton Ave, Vallejo, CA 94589For Sale
 MLS ID #41153713, Douglas Pankey. CCAR
- $--4 bd2 ba1.2k sqft829 Stanford Dr, Vallejo, CA 94589Auction
 Auction.com 2
- $540,0003 bd2 ba1.1k sqft739 Springfield Way, Vallejo, CA 94589For Sale
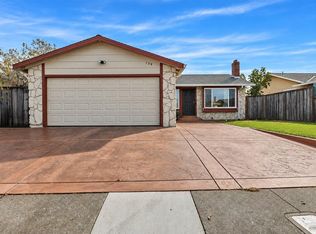 MLS ID #326094740, Uriel R Medina Del Toro, Unicorn Properties. BAREIS
- $475,0003 bd2 ba1.3k sqft144 Coloma Drive, Vallejo, CA 94589For Sale
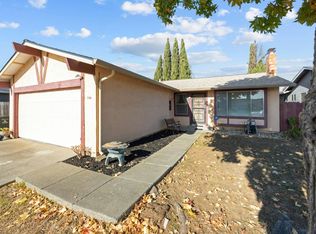 MLS ID #326094031, Dan Scott, Napa River Realty. BAREIS
