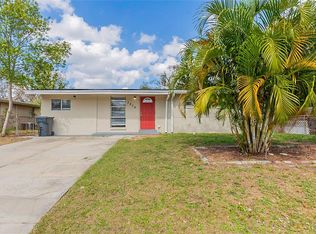
This 1380 square foot single family home has 4 bedrooms and 1.0 bathrooms. This home is located at 7206 E Cayuga St, Tampa, FL 33610.
Pre-foreclosure
Street View
Est. $252,900
7206 E Cayuga St, Tampa, FL 33610
4beds
1,380sqft
SingleFamily
Built in 1959
5,662 Square Feet Lot
$252,900 Zestimate®
$183/sqft
$-- HOA
Overview
- 334 days
- 8
- 0
Facts & features
Interior
Bedrooms & bathrooms
- Bedrooms: 4
- Bathrooms: 1
- Full bathrooms: 1
Heating
- Forced air, Other, Electric
Cooling
- Central
Appliances
- Included: Dryer, Microwave, Trash compactor, Washer
Features
- Flooring: Tile, Carpet
- Basement: None
Interior area
- Total interior livable area: 1,380 sqft
Property
Parking
- Parking features: Carport
Features
- Exterior features: Other, Cement / Concrete
Lot
- Size: 5,662 Square Feet
Details
- Parcel number: 1929021MS000003000220U
Construction
Type & style
- Home type: SingleFamily
Materials
- masonry
- Roof: Composition
Condition
- Year built: 1959
Community & HOA
Location
- Region: Tampa
Financial & listing details
- Price per square foot: $183/sqft
- Tax assessed value: $149,580
- Annual tax amount: $2,205
Foreclosure details
Estimated market value
$252,900
$225,000 - $278,000
$2,051/mo
Price history
| Date | Event | Price |
|---|---|---|
| 5/28/2021 | Sold | $150,000+30.4%$109/sqft |
Source: Public Record Report a problem | ||
| 6/15/2019 | Sold | $115,000+21.1%$83/sqft |
Source: Public Record Report a problem | ||
| 2/27/2006 | Sold | $95,000+0.1%$69/sqft |
Source: Public Record Report a problem | ||
| 9/13/2004 | Sold | $94,900+171.9%$69/sqft |
Source: Stellar MLS #T2062024 Report a problem | ||
| 11/21/1994 | Sold | $34,900$25/sqft |
Source: Public Record Report a problem | ||
Public tax history
| Year | Property taxes | Tax assessment |
|---|---|---|
| 2025 | $2,205 +8% | $149,580 +1.1% |
| 2024 | $2,042 +6% | $148,019 +3% |
| 2023 | $1,926 -12.1% | $143,708 +1.2% |
| 2022 | $2,190 +40.7% | $141,970 +35.3% |
| 2021 | $1,557 -21.1% | $104,902 +17.6% |
| 2020 | $1,974 +48.2% | $89,222 +88.5% |
| 2019 | $1,331 | $47,344 -28.2% |
| 2018 | $1,331 +6.7% | $65,954 +41.6% |
| 2017 | $1,248 +15.5% | $46,593 +31% |
| 2016 | $1,080 +12.5% | $35,570 -5.6% |
| 2015 | $960 -5.9% | $37,700 +10% |
| 2014 | $1,020 +7.2% | $34,273 +10% |
| 2013 | $952 +11% | $31,157 +7.5% |
| 2012 | $857 -13.6% | $28,993 -18.5% |
| 2011 | $992 -15.7% | $35,578 -21% |
| 2010 | $1,177 -27.9% | $45,024 -33.5% |
| 2009 | $1,633 -29.7% | $67,694 -33.6% |
| 2008 | $2,322 +2.5% | $101,888 +0.8% |
| 2007 | $2,265 +56.4% | $101,113 +24.7% |
| 2006 | $1,448 +0.8% | $81,103 +3% |
| 2005 | $1,436 | $78,741 +34.9% |
| 2004 | -- | $58,349 +27.4% |
| 2003 | -- | $45,800 +36.7% |
| 2002 | -- | $33,492 +1.6% |
| 2001 | -- | $32,965 -12% |
| 2000 | $341 | $37,473 |
Find assessor info on the county website
Monthly payment
Climate risks
Neighborhood: 33610
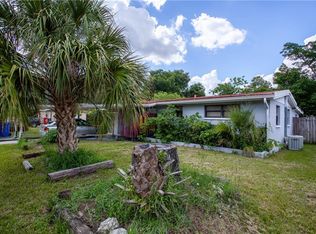

Similar homes
- $299,9004 bd2 ba1.1k sqft4402 N 72ND STREET, TAMPA, FL 33610For Sale
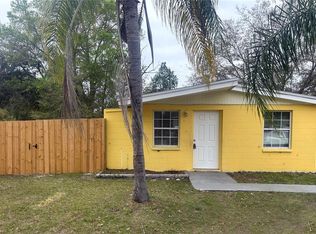
 MLS ID #O6448155, Steven Koleno, BEYCOME OF FLORIDA LLC. Stellar MLS
- $230,0003 bd2 ba1k sqft6210 N 45TH STREET, TAMPA, FL 33610For Sale
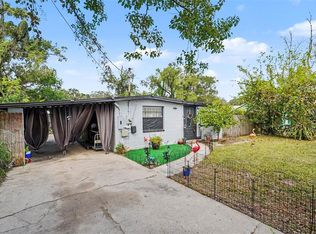 MLS ID #TB8561569, Richard Rung, MARK SPAIN REAL ESTATE. Stellar MLS
- $239,0004 bd2 ba1.4k sqft4102 WEDGEMERE DRIVE, TAMPA, FL 33610For Sale
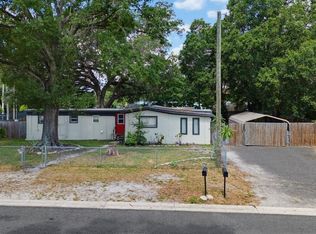 MLS ID #TB8554228, Ericka Elder, GALLUCCI MANAGEMENT LLC. Stellar MLS
- $217,9003 bd1 ba968 sqft7216 E EMMA STREET, TAMPA, FL 33610For Sale
 MLS ID #O6280017, Summer Brady, MAINSTAY BROKERAGE LLC. Stellar MLS
- $249,0003 bd1 ba1.2k sqft7512 RHODE ISLAND DRIVE, TAMPA, FL 33619For SaleMLS ID #TB8427225, Correy Smith, KELLER WILLIAMS SOUTH TAMPA. Stellar MLS
- $265,0003 bd1 ba1.2k sqft4833 ASHLAND DRIVE, TAMPA, FL 33610For SaleMLS ID #L4962564, Helen Weaver, GRACE OF GOD REALTY LLC. Stellar MLS
- $265,0003 bd1 ba812 sqft4214 E PALIFOX STREET, TAMPA, FL 33610For SaleMLS ID #TB8543350, Kristen Chester, DALTON WADE INC. Stellar MLS
- $310,0004 bd2 ba1.3k sqft4316 CLEWIS AVENUE, TAMPA, FL 33610For SaleMLS ID #O6428140, Steven Koleno, BEYCOME OF FLORIDA LLC. Stellar MLS
- $349,9003 bd2 ba1.3k sqft4218 EMPIRE PLACE, TAMPA, FL 33610For SaleMLS ID #TB8554187, Hilary Provost, BRANDYWINE HOMES USA. Stellar MLS
- $255,7003 bd1 ba904 sqft3602 N 55TH STREET, TAMPA, FL 33619For SaleMLS ID #TB8519433, Luamy Mazar Portuondo, AVENUE HOMES LLC. Stellar MLS
- $263,5004 bd1 ba1.2k sqft3209 N 45TH STREET, TAMPA, FL 33605For SaleMLS ID #O6431621, Summer Brady, MAINSTAY BROKERAGE LLC. Stellar MLS
- $325,0004 bd2 ba1.4k sqft5202 N 45TH STREET, TAMPA, FL 33610For SaleMLS ID #TB8563425, Betty Larralde, EXCLUSIVE HOMES REALTY, INC.. Stellar MLS
- $379,0004 bd2 ba1.6k sqft8015 TUDOR PLACE, TAMPA, FL 33610For SaleMLS ID #TB8542061, Yelena Shtefan, PA, THE ELITE REALTY EXPERIENCE. Stellar MLS
- $239,0003 bd2 ba1k sqft3113 GORDON COURT, TAMPA, FL 33619For SaleMLS ID #TB8552412, Jason Martinez, AQUA REAL ESTATE LLC. Stellar MLS
- $259,9003 bd3 ba1.8k sqft8009 TIPPERARY LN, TAMPA, FL 33610For SaleMLS ID #TB8559672, Md Awal, CHARLES RUTENBERG REALTY INC. Stellar MLS
- $319,6004 bd2 ba1.4k sqft4014 MCLANE DRIVE, TAMPA, FL 33610For SaleMLS ID #TB8551145, Allan Greenfield, PINEYWOODS REALTY LLC. Stellar MLS
- $265,0003 bd1 ba990 sqft3812 N 54TH STREET, TAMPA, FL 33619For SaleMLS ID #TB8549437, Kate Cottle, LPT REALTY LLC. Stellar MLS
- $240,0003 bd3 ba1.6k sqft9863 ASHBURN LAKE DRIVE, TAMPA, FL 33610For SaleMLS ID #TB8550629, Kelly Van Nevel, JASON MITCHELL REAL ESTATE FLO. Stellar MLS
- $230,0002 bd2 ba1.5k sqft4109 KEY THATCH DRIVE, TAMPA, FL 33610For SaleMLS ID #TB8561268, Christopher Holko, 27NORTH REALTY. Stellar MLS
