Virtually Staged. This 4 bedroom 2 bath home is a great value for the price. On a over sized corner lot with a newer roof. Centrally located near schools, shopping, dining, parks and more.
For sale
$245,000
820 LINDSEY PLACE, LAKE WALES, FL 33853
4beds
1,722sqft
Single Family Residence
Built in 2000
0.26 Acres Lot
$239,200 Zestimate®
$142/sqft
$17/mo HOA
What's special
Over sized corner lotNewer roof
- 1 day
- 181
- 28
Likely to sell faster than
Zillow last checked:
Listing updated:
Listed by:
Danielle Galloway 407-890-8168,
CFL REALTY PROS LLC 407-890-8168
Source: Stellar MLS,MLS#: O6455490 Originating MLS: Orlando Regional
Facts & features
Interior
Bedrooms & bathrooms
- Bedrooms: 4
- Bathrooms: 2
- Full bathrooms: 2
Primary bedroom
- Features: Walk-In Closet(s)
- Level: First
Kitchen
- Level: First
Living room
- Level: First
Heating
- Central
Cooling
- Central Air
Appliances
- Included: Dishwasher, Range, Refrigerator
- Laundry: Laundry Room
Features
- Vaulted Ceiling(s), Walk-In Closet(s)
- Flooring: Laminate
- Has fireplace: Yes
- Fireplace features: Wood Burning
Interior area
- Total structure area: 2,401
- Total interior livable area: 1,722 sqft
Video & virtual tour
Property
Parking
- Parking features: Garage - Attached
- Has attached garage: Yes
Features
- Levels: One
- Stories: 1
- Patio & porch: Covered, Screened
- Exterior features: Other
Lot
- Size: 0.26 Acres
- Dimensions: 95 x 120
- Features: Corner Lot
Details
- Parcel number: 272936880207000860
- Special conditions: None
Construction
Type & style
- Home type: SingleFamily
- Property subtype: Single Family Residence
Materials
- Block
- Foundation: Slab
- Roof: Shingle
Condition
- New construction: No
- Year built: 2000
Utilities & green energy
- Sewer: Public Sewer
- Water: Public
- Utilities for property: Electricity Connected
Community & HOA
Community
- Pet fee: $0 monthly
- Subdivision: HIGHLAND POINTE PH 02
HOA
- Has HOA: Yes
- HOA fee: $17 monthly
- HOA name: Highland Pointe
Location
- Region: Lake Wales
Financial & listing details
- Price per square foot: $142/sqft
- Tax assessed value: $222,997
- Annual tax amount: $4,668
- Date on market: 11/6/2026
- Cumulative days on market: 2 days
- Listing terms: Cash,Conventional,FHA
- Ownership: Fee Simple
- Total actual rent: 0
- Electric utility on property: Yes
- Road surface type: Asphalt
Estimated market value
$239,200
$227,000 - $251,000
$1,881/mo
Price history
| Date | Event | Price |
|---|---|---|
| 11/6/2026 | Listed for sale | $245,000+47.7%$142/sqft |
Source:  Stellar MLS #O6455490 Report a problem | ||
| 9/24/2026 | Sold | $165,900+84.5%$96/sqft |
Source: Public Record Report a problem | ||
| 10/3/2014 | Sold | $89,900$52/sqft |
Source: Public Record Report a problem | ||
| 8/20/2014 | Listed for sale | $89,900$52/sqft |
Source: SOUTHERN INVESTMENTS REALTY (255000251) #P4630062 Report a problem | ||
| 6/21/2014 | Listing removed | $89,900$52/sqft |
Source: SOUTHERN INVESTMENTS REALTY #P4630062 Report a problem | ||
| 6/2/2014 | Price change | $89,900-10%$52/sqft |
Source: SOUTHERN INVESTMENTS REALTY #P4630062 Report a problem | ||
| 5/20/2014 | Price change | $99,900+2%$58/sqft |
Source: SOUTHERN INVESTMENTS REALTY #P4630062 Report a problem | ||
| 5/18/2014 | Price change | $97,900-10.9%$57/sqft |
Source: SOUTHERN INVESTMENTS REALTY #P4630062 Report a problem | ||
| 4/20/2014 | Price change | $109,900-8.3%$64/sqft |
Source: SOUTHERN INVESTMENTS REALTY #P4630062 Report a problem | ||
| 4/6/2014 | Listed for sale | $119,900+566.1%$70/sqft |
Source: SOUTHERN INVESTMENTS REALTY #P4630062 Report a problem | ||
| 4/4/2000 | Sold | $18,000$10/sqft |
Source: Public Record Report a problem | ||
Public tax history
| Year | Property taxes | Tax assessment |
|---|---|---|
| 2025 | $4,494 +5.7% | $222,997 +0.5% |
| 2024 | $4,252 +160.1% | $221,806 +74.4% |
| 2023 | $1,635 +7.5% | $127,209 +3% |
| 2022 | $1,520 -0.4% | $123,504 +3% |
| 2021 | $1,526 +1.3% | $119,907 +1.4% |
| 2020 | $1,506 +0.8% | $118,251 +2.3% |
| 2019 | $1,494 -8.9% | $115,592 +1.9% |
| 2018 | $1,640 +1.3% | $113,437 +2.1% |
| 2017 | $1,618 +14% | $111,104 +2.1% |
| 2016 | $1,419 -34.3% | $108,819 +9.1% |
| 2015 | $2,160 +187.6% | $99,780 +30.6% |
| 2014 | $751 -3.7% | $76,398 +1.5% |
| 2013 | $780 +0.8% | $75,269 +1.7% |
| 2012 | $774 -21% | $74,011 -12.2% |
| 2011 | $979 -18.6% | $84,331 -10.9% |
| 2010 | $1,203 -30.5% | $94,690 -16.5% |
| 2009 | $1,731 +7.6% | $113,423 +0.1% |
| 2008 | $1,609 | $113,310 |
| 2007 | -- | -- |
| 2006 | $2,124 | -- |
| 2005 | -- | -- |
| 2004 | $1,988 +2.5% | -- |
| 2003 | $1,939 +2.2% | $99,280 -0.8% |
| 2002 | $1,897 +0.2% | $100,130 +0.2% |
| 2001 | $1,894 | $99,980 |
Find assessor info on the county website
Monthly payment
Est. payment
Payment breakdown
Explore the cost of this home by adjusting the details. Changes won't be saved.Climate risks
Neighborhood: 33853


Similar homes
- $250,0003 bd2 ba1.8k sqft1038 HIGHLAND CREST CIRCLE, LAKE WALES, FL 33853For Sale
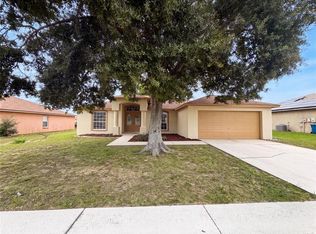
 MLS ID #O6429355, Karen Albright, OPENDOOR BROKERAGE LLC. Stellar MLS
- $265,0004 bd2 ba1.8k sqft722 HUNT DRIVE, LAKE WALES, FL 33853For Sale
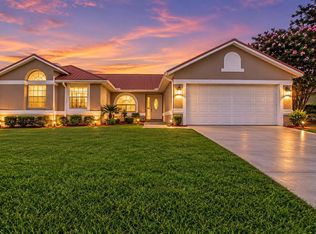 MLS ID #S5155590, Aizat Tuleeva, LPT REALTY, LLC. Stellar MLS
- $259,9904 bd2 ba1.6k sqft721 GREENLEAF LANE, LAKE WALES, FL 33853For Sale
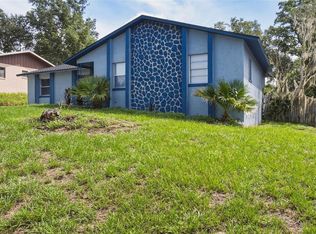 MLS ID #TB8553125, LaShawn Milton, XCLUSIVE REALTY LLC. Stellar MLS
- $240,0003 bd2 ba1.5k sqft819 CHAMBERLAIN LOOP, LAKE WALES, FL 33853For Sale
 MLS ID #S5157982, Usladys Zarzuela, ZARZUELA REALTY, LLC. Stellar MLS
- $249,9004 bd2 ba1.7k sqft613 PALM AVENUE, LAKE WALES, FL 33853For SaleMLS ID #K4903850, David Craig, 1513 REALTY LLC. Stellar MLS
- $270,0003 bd2 ba1.7k sqft774 BARCLAY TERRACE, LAKE WALES, FL 33853For SaleMLS ID #O6400035, Frances Speights, KELLER WILLIAMS ADVANTAGE III. Stellar MLS
- $229,0004 bd2 ba1.4k sqft911 EXMOOR WAY, LAKE WALES, FL 33853For SaleMLS ID #O6451916, Laconza Oliver, RENO REALTY LLC. Stellar MLS
- $252,0004 bd2 ba1.6k sqft505 SCENIC BLUFF BOULEVARD, LAKE WALES, FL 33853For SaleMLS ID #TB8548090, Nancy Monsipapa, FIRESIDE REAL ESTATE. Stellar MLS
- $300,0003 bd2 ba1.5k sqft706 HIGHLAND CREST LOOP, LAKE WALES, FL 33853For SaleMLS ID #O6438300, Daniel Betancourt, EXP REALTY LLC. Stellar MLS
- $295,0004 bd2 ba1.7k sqft1015 HIGHLAND CREST CIRCLE, LAKE WALES, FL 33853For SaleMLS ID #K4903176, Vicky Holloway, LEGACY REAL ESTATE CENTER INC. Stellar MLS
- $290,0003 bd2 ba1.4k sqft811 HILLSIDE AVENUE, LAKE WALES, FL 33853For SaleMLS ID #TB8540384, Yulien Yon Martin, JPT REALTY LLC. Stellar MLS
- $270,0002 bd2 ba1.6k sqft530 S 7TH STREET, LAKE WALES, FL 33853For SaleMLS ID #P4940217, Malak Hassani Benbachir, KELLER WILLIAMS REALTY SMART 1. Stellar MLS
- $300,0004 bd2 ba1.6k sqft808 CHAMBERLAIN LOOP, LAKE WALES, FL 33853For SaleMLS ID #TB8534665, Gabe Hatch, ORCHARD BROKERAGE, LLC. Stellar MLS
- $305,0003 bd2 ba1.5k sqft922 CHELSEA WAY, LAKE WALES, FL 33853For SaleMLS ID #L4965596, Anita Lowe, LOCKHART & ASSOCIATES INC. Stellar MLS
- $221,0002 bd2 ba1.4k sqft719 HILLSIDE AVENUE, LAKE WALES, FL 33853For SaleMLS ID #S5139972, Hortencia Aponte, LPT REALTY, LLC. Stellar MLS
- $310,0004 bd4 ba2.4k sqft848 WILDABON AVENUE, LAKE WALES, FL 33853For SaleMLS ID #S5157923, Jesse Carriedo, REALTYCITY INC. Stellar MLS
- $299,7503 bd2 ba1.7k sqft1152 VIEW POINTE CIRCLE, LAKE WALES, FL 33853For SaleMLS ID #O6361433, Ancizar Alzate, EXP REALTY LLC. Stellar MLS
- $230,0003 bd1 ba1.3k sqft307 STEEDLY AVENUE, LAKE WALES, FL 33853For SaleMLS ID #L4965320, Shalisa Muehlberger, S & D REAL ESTATE SERVICE LLC. Stellar MLS
