Brand new electrical panel on this property. This duplex is currently occupied, both units at market rent. Convenient location in Tampa. Agent can provide more photos upon request.
Pre-foreclosure
Est. $302,100
903 E 124th Ave, Tampa, FL 33612
--beds
0baths
1,156sqft
Duplex
Built in 1965
-- sqft lot
$302,100 Zestimate®
$261/sqft
$-- HOA
Overview
- 19 days
- 15
- 0
Originating MLS: Tampa
Facts & features
Interior
Bedrooms & bathrooms
- Bathrooms: 0
Heating
- Other, Electric
Cooling
- Wall
Features
- Flooring: Other, Concrete, Hardwood
Interior area
- Total interior livable area: 1,156 sqft
Property
Features
- Exterior features: Cement / Concrete
Lot
- Size: 5,000 Square Feet
- Dimensions: 50X100
Details
- Parcel number: 1928071GS000000000110U
- Zoning: RDC-12
Construction
Type & style
- Home type: MultiFamily
- Property subtype: Duplex
Materials
- masonry
- Roof: Composition
Condition
- Year built: 1965
Utilities & green energy
- Sewer: Public Sewer
- Water: Public
- Utilities for property: Electricity Connected, Cable Available
Community & HOA
Community
- Subdivision: REVISED MAP OF FLOWERS & STU
Location
- Region: Tampa
Financial & listing details
- Price per square foot: $261/sqft
- Tax assessed value: $125,259
- Annual tax amount: $3,435
- Listing terms: Cash
- Ownership: Fee Simple
Foreclosure details
Estimated market value
$302,100
$275,000 - $332,000
$1,849/mo
Price history
| Date | Event | Price |
|---|---|---|
| 9/27/2024 | Listing removed | $320,000$277/sqft |
Source:  Stellar MLS #T3521590 Report a problem | ||
| 5/23/2024 | Price change | $320,000-1.5%$277/sqft |
Source: Stellar MLS #T3521590 Report a problem | ||
| 4/24/2024 | Listed for sale | $325,000+62.5%$281/sqft |
Source: Stellar MLS #T3521590 Report a problem | ||
| 1/5/2024 | Sold | $200,000+33.3%$173/sqft |
Source: Public Record Report a problem | ||
| 5/10/2021 | Listing removed | -- |
Source: Stellar MLS #T3278994 Report a problem | ||
| 3/20/2021 | Listed for sale | $149,999$130/sqft |
Source: Stellar MLS #T3278994 Report a problem | ||
| 2/18/2021 | Pending sale | $149,999$130/sqft |
Source: Stellar MLS #T3278994 Report a problem | ||
| 1/25/2021 | Listed for sale | $149,999$130/sqft |
Source: Stellar MLS #T3278994 Report a problem | ||
| 1/19/2021 | Pending sale | $149,999$130/sqft |
Source: Stellar MLS #T3278994 Report a problem | ||
| 1/19/2021 | Listed for sale | $149,999$130/sqft |
Source: Stellar MLS #T3278994 Report a problem | ||
| 12/24/2020 | Pending sale | $149,999$130/sqft |
Source: OUT FAST REALTY & INVESTMENTS LLC #T3278994 Report a problem | ||
| 12/6/2020 | Listed for sale | $149,999+31.6%$130/sqft |
Source: OUT FAST REALTY & INVESTMENTS LLC #T3278994 Report a problem | ||
| 7/14/2020 | Sold | $114,000+208.1%$99/sqft |
Source: Public Record Report a problem | ||
| 9/22/1999 | Sold | $37,000-88.6%$32/sqft |
Source: Public Record Report a problem | ||
| 1/8/1999 | Sold | $325,000$281/sqft |
Source: Public Record Report a problem | ||
Public tax history
| Year | Property taxes | Tax assessment |
|---|---|---|
| 2025 | $3,435 +16.5% | $125,259 +15.1% |
| 2024 | $2,949 +0.4% | $108,816 -3.3% |
| 2023 | $2,938 +10.2% | $112,510 +7.6% |
| 2022 | $2,665 +7% | $104,558 +10% |
| 2021 | $2,491 +46.4% | $95,053 +105.1% |
| 2020 | $1,701 +16.7% | $46,354 +10% |
| 2019 | $1,457 | $42,140 -23.3% |
| 2018 | $1,457 +8% | $54,959 +29.8% |
| 2017 | $1,349 +9.8% | $42,337 +33.7% |
| 2016 | $1,229 +10.9% | $31,660 +8.4% |
| 2015 | $1,108 +5.8% | $29,195 +3.1% |
| 2014 | $1,047 | $28,304 +10% |
| 2013 | $1,047 +7.3% | $25,731 +9.8% |
| 2012 | $976 -5.4% | $23,434 -10.4% |
| 2011 | $1,032 -10.3% | $26,145 -18.8% |
| 2010 | $1,151 -21% | $32,215 -33% |
| 2009 | $1,457 -23.4% | $48,047 -32.3% |
| 2008 | $1,903 -2.7% | $70,986 -6.6% |
| 2007 | $1,955 -1.2% | $76,019 +5% |
| 2006 | $1,978 -6% | $72,415 +19.4% |
| 2005 | $2,105 | $60,635 +10.8% |
| 2004 | -- | $54,733 +28% |
| 2003 | -- | $42,774 +3.9% |
| 2002 | -- | $41,174 +20% |
| 2001 | -- | $34,306 +17% |
| 2000 | $824 | $29,311 |
Find assessor info on the county website
Monthly payment
Climate risks
Neighborhood: 33612
Similar homes
- $314,9004 bd2 ba1.4k sqft8304 N 13TH STREET, TAMPA, FL 33604For Sale
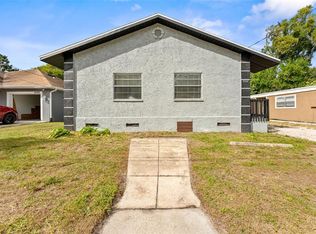
 MLS ID #TB8563535, Sonja Haltiwanger, LLC, OFFERPAD BROKERAGE FL, LLC. Stellar MLS
- $289,0004 bd2 ba1.1k sqft10101 N 11TH STREET, TAMPA, FL 33612For Sale
 MLS ID #TB8427304, Correy Smith, KELLER WILLIAMS SOUTH TAMPA. Stellar MLS
- $294,9003 bd2 ba1.1k sqft1807 E BOUGAINVILLEA AVENUE, TAMPA, FL 33612For Sale
 MLS ID #TB8552499, Ramez Lahham, YOU FIRST REALTY AND ASSOC LLC. Stellar MLS
- $279,9004 bd2 ba1k sqft704 E WILMA STREET, TAMPA, FL 33612For Sale
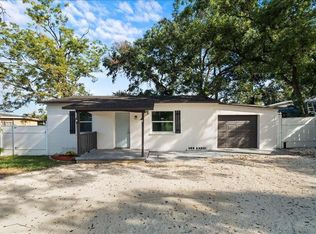 MLS ID #TB8546760, Hachem Fariad, YOU FIRST REALTY AND ASSOC LLC. Stellar MLS
- $294,9003 bd2 ba945 sqft10410 N 27TH STREET, TAMPA, FL 33612For SaleMLS ID #O6428331, Robert Salmons, ENTERA REALTY LLC. Stellar MLS
- $342,0004 bd3 ba1.3k sqft10905 N 22ND STREET, TAMPA, FL 33612For SaleMLS ID #TB8543093, William Roberts, ALIGN RIGHT REALTY LLC. Stellar MLS
- $365,0004 bd3 ba1.2k sqft2110 E 97TH AVENUE, TAMPA, FL 33612For SaleMLS ID #O6450724, Husain Jaffer, CHARLES RUTENBERG REALTY ORLANDO. Stellar MLS
- $285,0005 bd2 ba1.7k sqft9404 N MULBERRY STREET, TAMPA, FL 33612For SaleMLS ID #TB8413921, Carmine Petruzziello, THE SOMERDAY GROUP PL. Stellar MLS
- $319,0003 bd2 ba1.3k sqft14902 PINECREST ROAD, TAMPA, FL 33613For SaleMLS ID #TB8559499, Mark Koert, KOERT & ASSOCIATES. Stellar MLS
- $310,0003 bd2 ba1.1k sqft8212 N 14TH STREET, TAMPA, FL 33604For SaleMLS ID #TB8545216, Irvin Beacham, Jr., BEACHAM REALTY GROUP LLC. Stellar MLS
- $309,0004 bd2 ba1k sqft4224 E REGNAS AVENUE, TAMPA, FL 33617For SaleMLS ID #TB8535378, Golf Phuphanich, LPT REALTY, LLC. Stellar MLS
- $298,0003 bd2 ba906 sqft8202 N ALASKA STREET, TAMPA, FL 33604For SaleMLS ID #TB8553673, Yuxisisbeydi Silva Gonzalez, FRIENDS REALTY LLC. Stellar MLS
- $269,0004 bd2 ba1k sqft128 E 145TH AVENUE, TAMPA, FL 33613For SaleMLS ID #TB8512503, Joseph Germinerio, KELLER WILLIAMS ST PETE REALTY. Stellar MLS
- $324,9002 bd1 ba1k sqft8407 N NEWPORT AVENUE, TAMPA, FL 33604For SaleMLS ID #TB8560082, Karen Irace, RE/MAX ACTION FIRST OF FLORIDA. Stellar MLS
- $300,0003 bd1 ba916 sqft8603 N 29TH STREET, TAMPA, FL 33604For SaleMLS ID #TB8553621, Calvin Pringles, DALTON WADE INC. Stellar MLS
- $419,3005 bd3 ba1.7k sqft2706 E ANNIE STREET, TAMPA, FL 33612For SaleMLS ID #A4697898, Lacey Kramer, NEW DOOR REAL ESTATE LLC. Stellar MLS
- $319,5003 bd2 ba1.5k sqft8608 N 20TH STREET, TAMPA, FL 33604For SaleMLS ID #O6446722, Samantha Drzata, REALTY ONE GROUP INSPIRATION. Stellar MLS
- $275,0003 bd2 ba1.1k sqft1804 E IDLEWILD AVENUE, TAMPA, FL 33610For SaleMLS ID #TB8515289, Gisselle Flores, COMPASS FLORIDA LLC. Stellar MLS
- $174,9002 bd1 ba1.2k sqft911 E 123RD AVENUE, TAMPA, FL 33612For SaleMLS ID #TB8526988, Mariela Saban, MARK SPAIN REAL ESTATE. Stellar MLS
- $249,9003 bd2 ba1k sqft828 E 145TH AVENUE, TAMPA, FL 33613For SaleMLS ID #O6409491, Robert Salmons, ENTERA REALTY LLC. Stellar MLS
