Buyers: Results from the Zillow Consumer Housing Trends Report 2021
The 2021 Consumer Housing Trends Report (CHTR) provides a snapshot of what housing consumers are thinking and doing in mid-2021. In this report, we take a deeper look at buyers (household decision makers that own their primary residence and moved to a home they purchased in the past year); In other reports, we examine homeowners, renters, and sellers more closely.

Written by Edward Berchick on September 1, 2021
Executive Summary
A global pandemic, historic economic change and an unprecedented shift in the housing market have been hallmarks of the past year. But while these large-scale changes have shifted the landscape and have the potential to reshape buyers’ preferences over the longer term, many behaviors and attitudes remain the same.
The 2021 Consumer Housing Trends Report (CHTR) provides a snapshot of what housing consumers are thinking and doing in mid-2021. In this report, we take a deeper look at buyers (household decision makers that own their primary residence and moved to a home they purchased in the past year); In other reports, we examine homeowners, renters, and sellers more closely.
Who are buyers?
The average US buyer is 45 years old, partnered or married, has at least some college education, and is most likely to buy a home in the South. Demographic change tends to play out over a long time: Most of these characteristics have not changed substantially, if at all, over the last few years. Half of buyers moved from a previous home they owned and sold that previous primary residence.
What do their homes look like?
Most buyers purchased a single-family detached house -- however, other home types like a townhouse/rowhouse (11%) or condo/co-op (10%) appear to have become more common among buyers surveyed in 2021. The typical buyer’s home has three bedrooms, three bathrooms and is 1,000-1,999 square feet.1 Most buyers (61%) moved from a previous home they owned (or still own).
Buying a home got more challenging
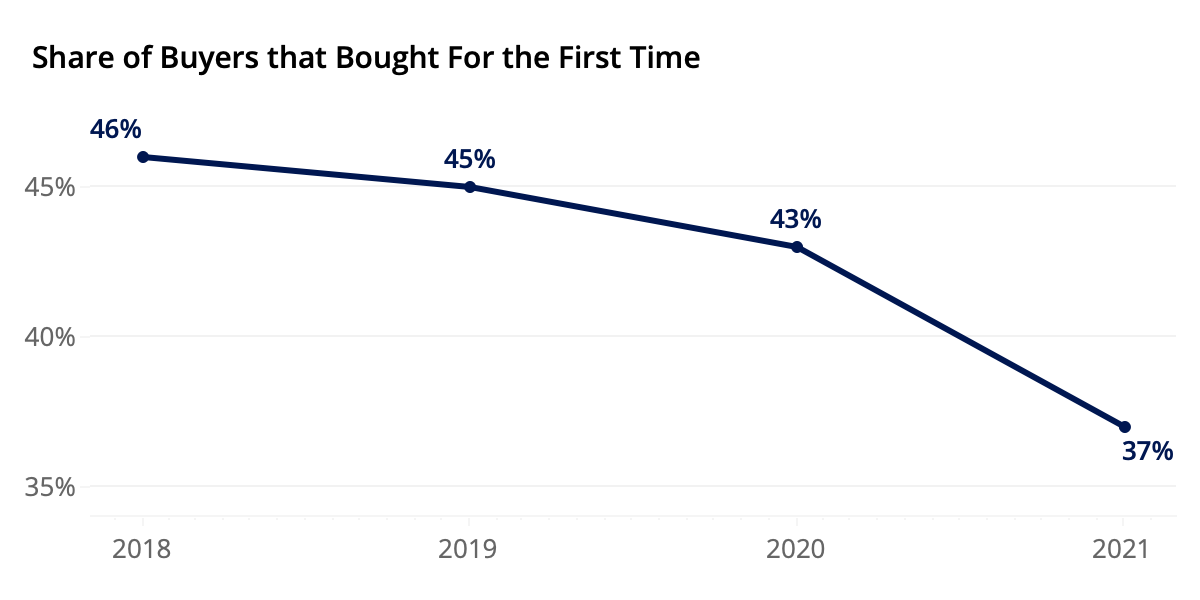
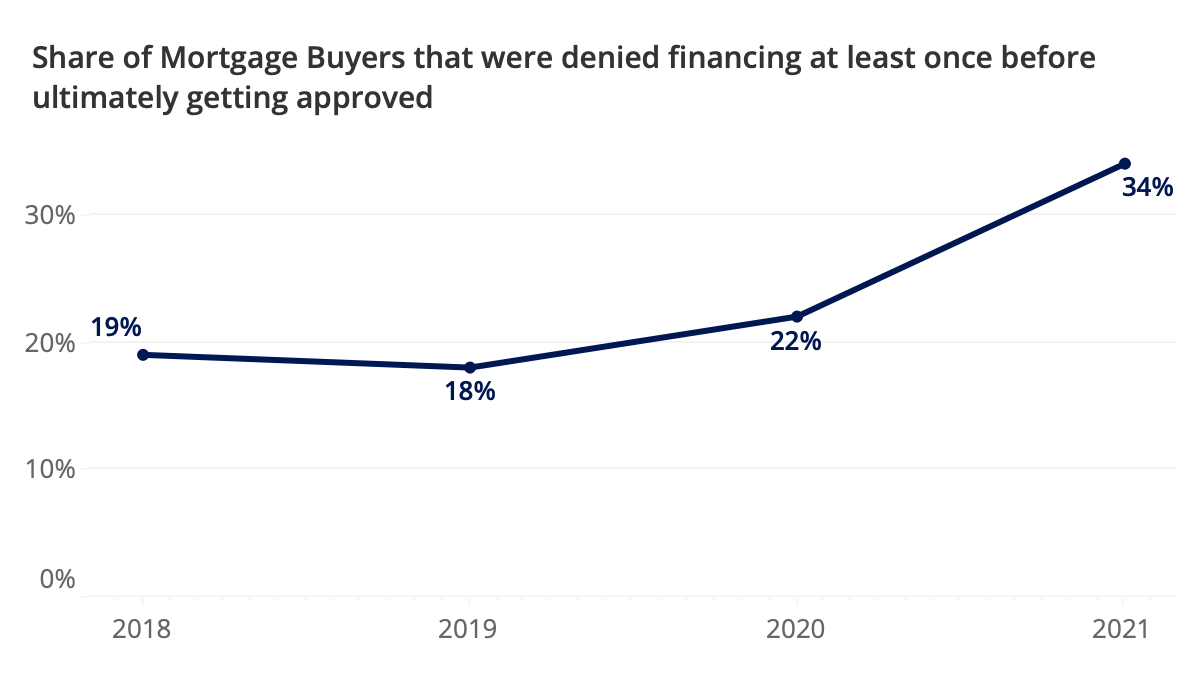
Despite low interest rates and an increased desire among renters to buy their next home, 2021’s survey suggests that homebuying became more challenging than past years. The typical (median) buyer submitted two offers, up from just one offer that typical buyers consistently reported making over the previous three years (2018 - 2020). First-time buyers also got more scarce: they represented 43% of buyers when surveyed in 2020, but only 37% in 2021. Coupled with low inventory, a busy mortgage market (driven in part by elevated refinance activity that adds to an already full pipeline of applications) may have added hurdles to an already challenging housing market. Mortgage buyers were 50% more likely to report facing at least one denial before ultimately being approved in 2021 than they were in the previous year.
What characteristics do they value in a home?
Buyers are most likely to say that a home that’s within their initial budget (84%) and one with air conditioning (84%) are very or extremely important. Having their preferred number of bedrooms (78%) and ample storage (75%) followed .
What prompted buyers to move?
Overall, 72% of buyers say that a life event influenced their decision to move to a new home: The most common life event buyers cited for moving was a change in their household or family size (42%), followed by working remotely more often (30%) and a new job or job transfer (28%). Financial circumstances also play a part: Almost two-thirds of buyers that financed with a mortgage said low mortgage interest rates influenced their decision to buy (60%). Half of these same mortgage buyers (50%) said that having saved up enough for a down payment influenced them as well.
What technology do they want for home shopping?
When asked if they agreed with a series of statements about their desire for 3D and Virtual home tour technology, buyers were more likely to at least somewhat agree that such tools would be helpful. Majorities of buyers agreed somewhat or completely that 3D tours would give them a better feel for the space than static photos (68%), it would be easier to unlock properties on their phone and tour them in-person on their own time (63%), they wish more listings had 3D tours (61%), and that they prefer to schedule in-person tours online (61%). Each of these represents an increase over 2020 -- when the pandemic likely caused buyers to be more likely to agree with each at higher rates than 2019.
Survey Methodology
Research Approach
In order to gain a comprehensive understanding of U.S. buyers, Zillow Group Population Science conducted a nationally representative survey of more than 2,000 buyers. The study was fielded between March and August 2021. Wherever possible, survey questions from previous years were asked in the same manner this year to allow for the measurement of year-to-year trends in key areas of interest. This year was the first year that ZG Population Science designed, fielded and analyzed the survey entirely in-house.
For the purpose of this study, “buyers” refers to household decision makers 18 years of age or older who moved to a new primary residence that they purchased in the past year.
Sampling & Weighting
Results from this survey are nationally representative of buyers. To achieve representativeness, ZG Population Science used a two-prong approach. First, the initial recruitment to the sample was balanced to all buyers from the U.S. Census Bureau, 2019 American Community Survey (ACS) on the basis of age, relationship status, income, ethnicity/race, education, region and sex. Additional targeted subgroups were sampled based on all key household demographic characteristics. Second, statistical raking was used to create calibration weights to ensure that the distribution of survey respondents matched the U.S. population with respect to a number of key demographic characteristics.
Quality Control
To reduce response bias, survey respondents did not know that Zillow Group was conducting the survey. Several additional quality control measures were also taken to ensure data accuracy:
- We identified and terminated any professional respondents, robots or those taking the survey on multiple devices.
- Completion times were recorded to ensure that surveys submitted by the fastest respondents, who may have rushed through the survey, did not provide poor quality data. If necessary, these respondents were removed from the sample.
- In-survey quality control checks identified illogical or unrealistic responses.
Additional Data Sources
Unless otherwise specified, estimates in this report come from the Consumer Housing Trends Report (CHTR) 2021, and year-over-year comparisons also use data from CHTR 2018, CHTR 2019 and CHTR 2020. To provide a fuller picture of the state of home rentals and buyers’ characteristics, preferences and behaviors, we also analyzed data from other sources:
- U.S. Census Bureau, 2019 American Community Survey - The most recently available dataset from the U.S. Census Bureau’s survey of the U.S. population. The ACS is the nation’s largest survey and is based on a probability sample; as such, it is considered one of the leading sources of information on U.S. population and housing.
The Typical Buyer & Home Bought
In this section, we provide a high-level overview of key buyer info and what their homes look like. According to the most recent Census Bureau American Community Survey (ACS) data available, 5% of adults in the country are recent buyers. Throughout this section, information about buyers comes from CHTR, and information about other groups comes from ZG Population Science analyses using ACS data.
Age
The median age of U.S. buyers is 43, while the average skews higher (45 years old). Almost one in five buyers (17%) are in their twenties or younger, while roughly a quarter (23%) are in their sixties or older. In other words, the age distribution of buyers represents somewhat of a middle ground when it comes to the U.S. population: They are typically younger than tenured homeowners (those who have not moved in the past year), but older than renters.
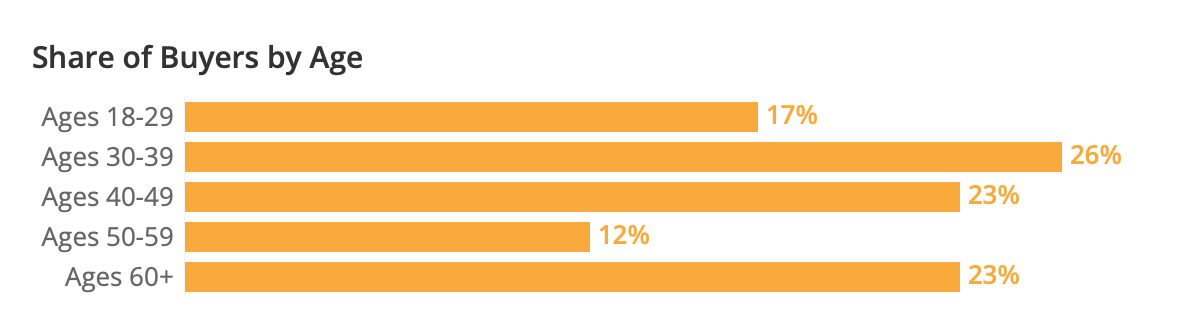
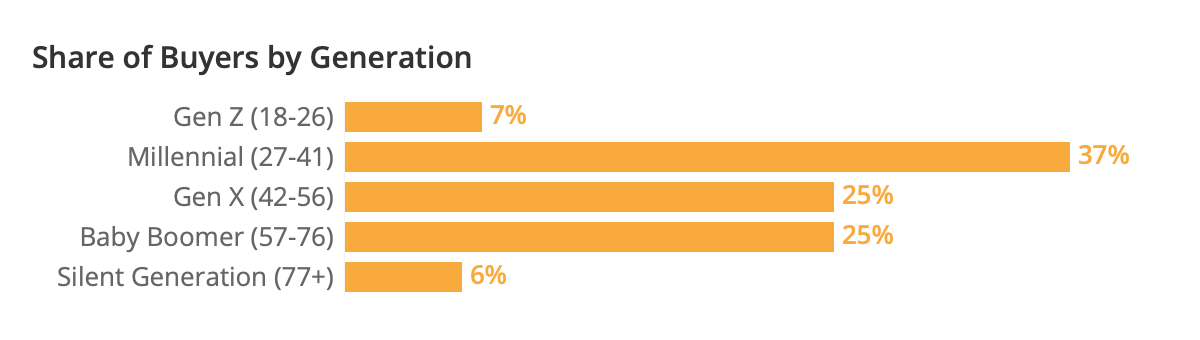
Consistent with age, the largest generational group of buyers is between 27 and 41 years old in 2021 -- the group colloquially known as “Millennials.” About 37% of buyers are Millennials.2
Race & Ethnicity
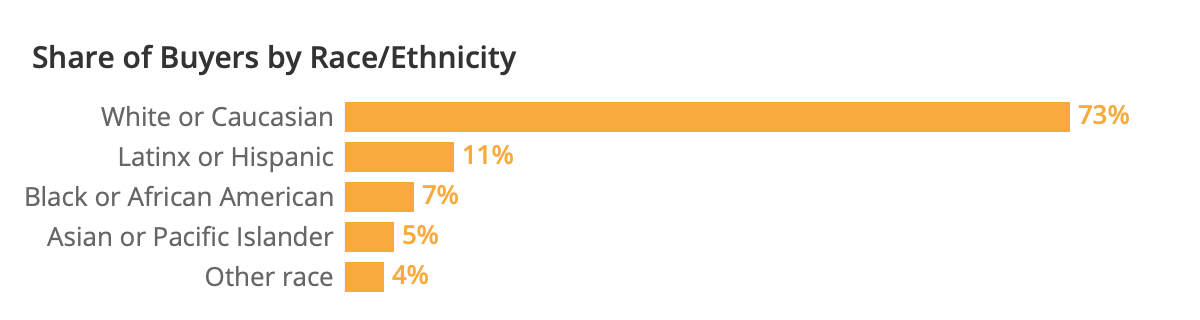
About three quarters of buyers are non-Hispanic white or Caucasian (73%), higher than the overall share of the U.S. adult population that is white (63%). At the same time, 12% of U.S. adults identify as non-Hispanic Black or African American, but just 7% of buyers are Black.
Region
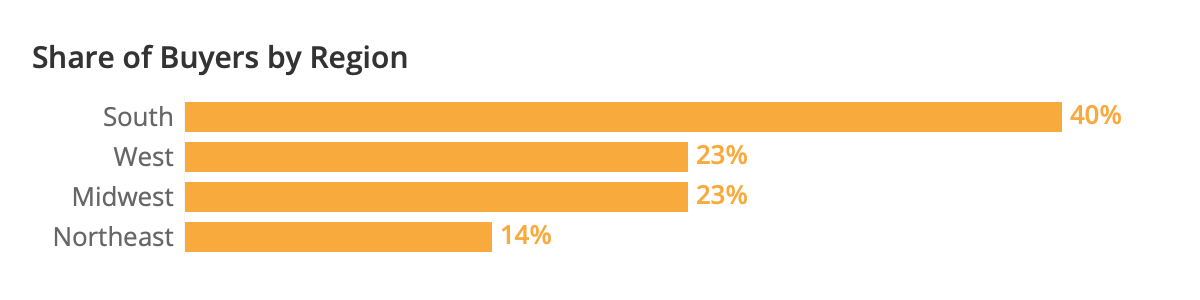
The largest share of buyers live in the South (40%), followed by the West (23%) and Midwest (23%). The smallest share lives in the Northeast (15%). Buyers largely follow the distribution of US adults, with a slightly higher concentration in the South and Midwest -- likely because these regions have more for-sale inventory.
Gender Identity & Sexual Orientation

The percentage of buyers identifying as LGBTQ+ has been on a stable and slight upward trend over the last few years. About one in fourteen (7%) buyers identified as LGBTQ+ in 2019, the first year CHTR asked about sexual orientation and gender identity, then 9% in 2020.3 This likely represents the growing share of buyers, many of whom were born in more recent years, who may be more likely to feel comfortable self-identifying as LGBTQ+.
Income
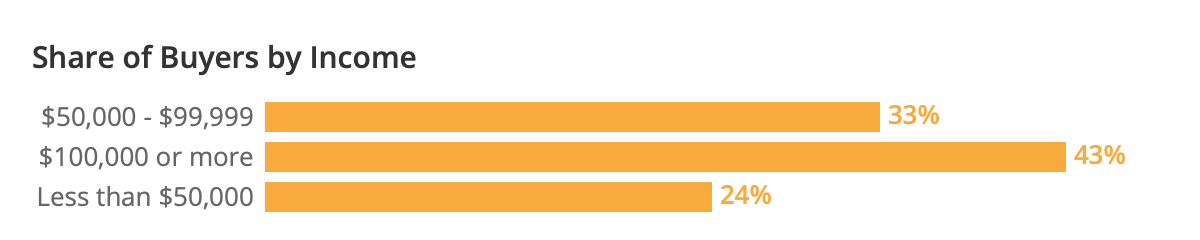
Buyers tend to have higher household incomes than the U.S. population overall. The annual median household income among buyers is approximately $86,000, compared to the overall national median (2019) of $65,700.4
n
Education
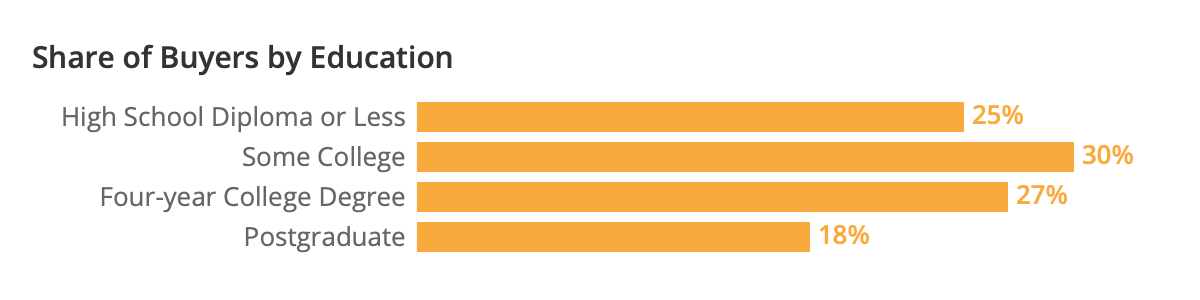
Buyers tend to be more educated than the overall population of U.S. household decision makers: 45% of buyers have at least a four-year degree, higher than 34% of overall U.S. household decision makers.
Relationship Status
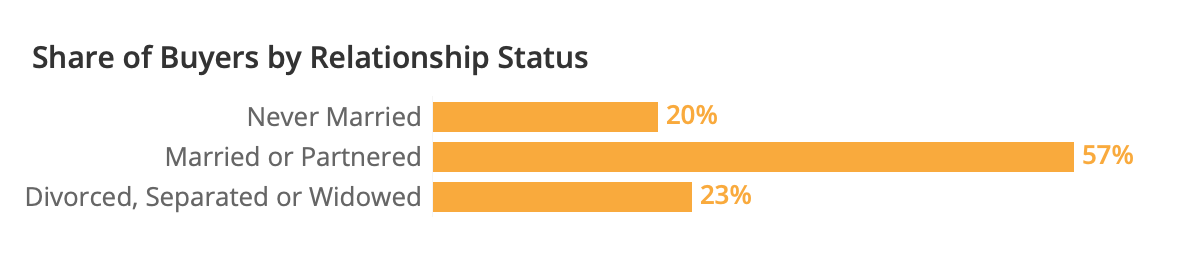
Prior research has shown that the purchase of a home is often tied to family formation or other life events, like a divorce or separation. This relationship between homeownership and family formation helps explain why over half of buyers are currently married/partnered (57%) and almost a quarter (23%) have been married in the past.
Household Composition5
- 40% of buyers have children under age 18 in their homes
- 4% of buyers have their parents or parents-in-law in their homes
- 57% have at least one dog
- 39% have at least one cat
- 15% have another kind of pet
Urbanicity
Almost half of buyers (44%) describe the area where they bought as suburban; 38% say they bought in an urban area, and the remaining 19% say they bought in a rural area.
Home Type, Beds, Baths, and Size
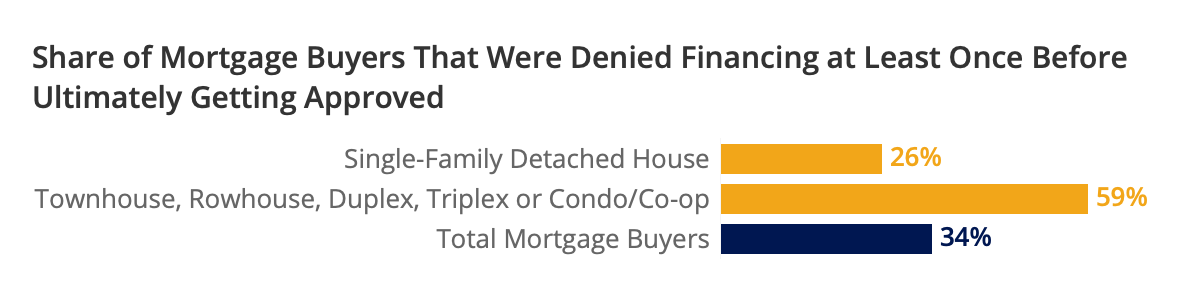
The typical (median) buyer bought a 3-bed, 3-bath, single-family detached house between 1,000 and 1,999 square feet. While a majority of buyers across urban, suburban and rural areas reported buying a single-family detached house, there was a significant increase from prior years in the share of buyers that purchased another home type, including a townhouse (11%, up from 8% in 2020) or condo/co-op (10%, up from 6% in 2020).6 Given low inventory and an unusually competitive housing market, buyers may have gravitated toward many of these more-affordable and/or relatively more-available home types as an option that fit their budget.
Buying a Home Got More Difficult: More Offers, More Mortgage Denials, and Fewer First-Time Buyers
First-Time Buyers Took a Hit
Between 2018 and 2020, the share of buyers that purchased a home for the first time trended slightly downward (46% in 2018, down to 43% in 2020). In 2021, however, the downward trend accelerated: 37% of buyers were first-timers. Low supply of for-sale homes and competition with other buyers amidst a stretched mortgage market (competing for brokers’ time and resources with existing homeowners refinancing to historically low interest rates) may have contributed to this decline in first-time buyers.
First-time buyers more likely to feel hurried
About one in four (25%) first-time buyers said that they had to buy a home quickly -- compared to a smaller share (17%) of repeat buyers. Conversely, repeat buyers were more likely to describe their timeline for home shopping as “relaxed.” Two in five (41%) repeat buyers said that they were able to take their time and explore their options, compared to less than a third (29%) of first-time buyers.

Two Offers is Typical for Recent Buyers -- Up From Previous Years

The typical (median) buyer submitted two offers -- up from the single offer that typical buyers consistently reported over the previous three years (2018 - 2020). The share of buyers that made only one offer dropped to about one in three (36%, from 48% in 2020, 49% in 2019, and 52% in 2018). Conversely, the share that made two or more grew: About three in five (59%) of buyers reported making two or more offers -- up significantly from roughly two in five in years past (42% in 2020, 40% in 2019, and 38% in 2018). 7
First-time buyers were more likely to report that they made two or more offers: About two thirds (67%) made at least two during their home buying process -- higher than about half (54%) of repeat buyers. The younger age skew of first-time buyers (typically 36 years old) means that they tend to be less experienced with home buying, have fewer years to save, and are generally unable to tap equity from a previous home sale (except in rarer cases where they acquire a home through circumstances like inheritance or marriage).
Cash Buyers More Common
In 2020, 28% of buyers said that they paid for their home in full without a mortgage. In 2021, that share grew to about a third (32%).

Among homeowners that had not listed their homes for sale, about one in nine (12%) cited recently refinancing as a reason for staying put. Many of these refinancing homeowners -- representing at least 1.3 million homeowner households -- may have overwhelmed the finite capacity of certain lenders at the expense of aspiring homebuyers.
Increasing Likelihood of Going Over Budget Persists
Since 2018, the share of buyers that say they purchased a home at a price higher than their initial budget has crept upward. In 2018, 23% of buyers said they bought a home for more than their initial budget -- increasing to 26% in 2019, 27% in 2020, and 28% in 2021.
Buyers that bought with a mortgage were more likely to report going over budget (33% said they did. as opposed to 19% of those that bought their home in full with cash) -- possibly a sign that, in order to keep up with the increased presence of cash buyers, mortgage buyers had to make larger offers to remain competitive.
Mortgage Buyers More Likely to Face a Mortgage Denial
Consistent with a more challenging housing market for buyers, the share of buyers that faced at least one mortgage denial before getting approved grew from 22% in 2020 to 34% in 2021. 8
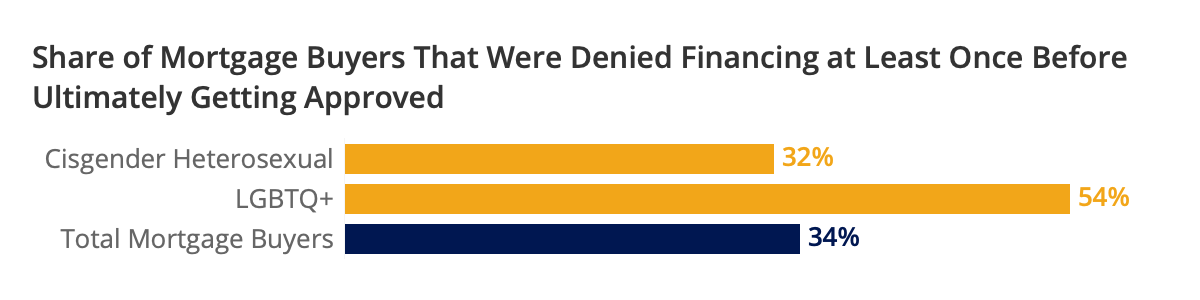
Younger, First-Time, Nonwhite, and LGBTQ+ Mortgage Buyers Were More Likely to Face At Least One Mortgage Denial
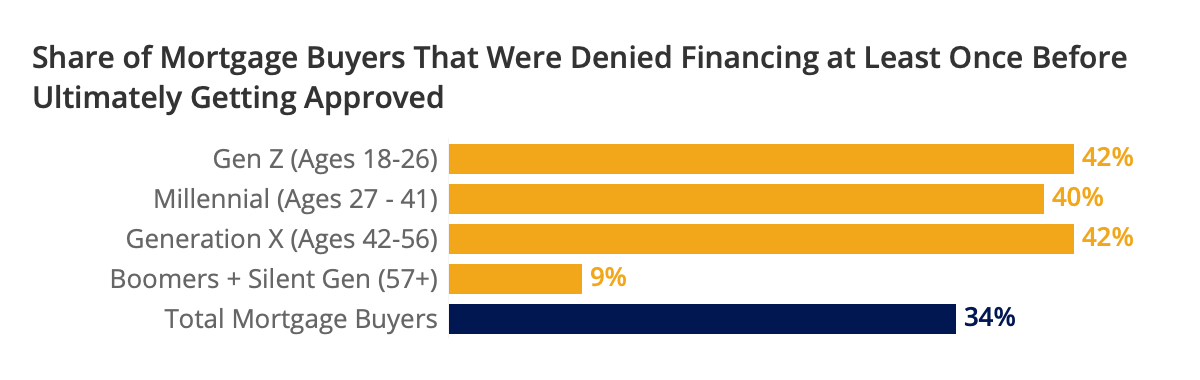
Younger mortgage buyers are significantly more likely to report being denied financing at least once, compared with their older counterparts. Only one in ten (9%) of Baby Boomer and Silent Generation mortgage borrowers reported being denied financing -- much lower than 42% of Gen X, 40% of Millennial and 42% of Gen Z mortgage buyers.
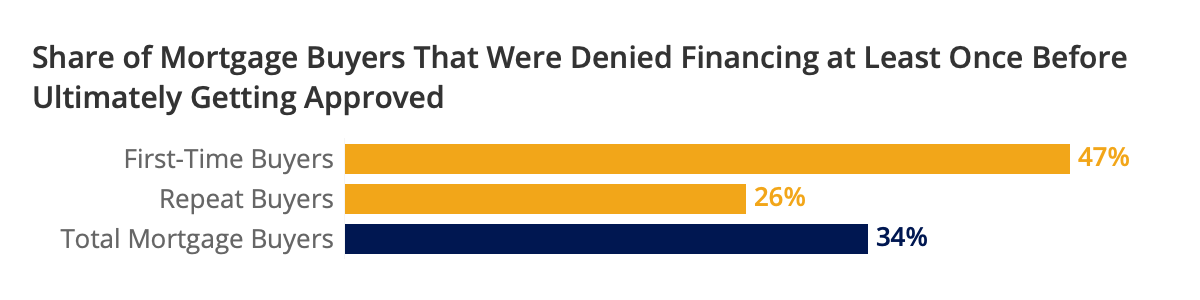
It is likely that the younger age skew of first-time buyers (typically age 36) and buyers who identify as LGBTQ+ (typically age 32) contributes to the fact that each is more likely to report at least one mortgage denial when applying for financing. Each of these groups trends younger than the typical buyer, whose typical age has remained between 43 and 44 years old over the last few years. In this case, age can be more than just a number -- it’s partly indicative of how long someone has had to grow their savings, build their credit, and potentially pay off student loans. Half (50%) of buyers with a mortgage said saving up enough for a down payment influenced their decision to move. And two thirds (67%) of mortgage buyers said they financed at least part of their down payment with money they had saved up over time. Given this dependence on savings, more time to save can often translate to a more ironclad mortgage application.
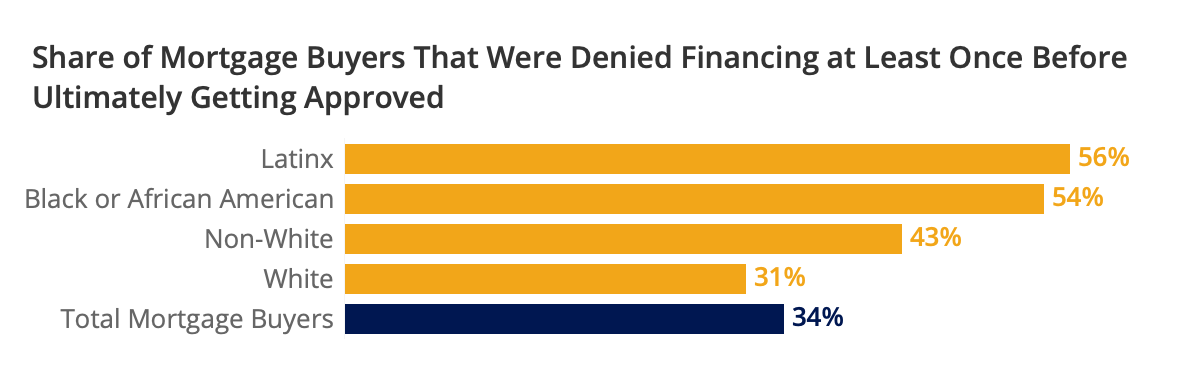
Mortgage buyers of color are more likely to experience a mortgage denial before ultimately being approved: About half of Black (54%) and Latinx (56%) mortgage buyers reported at least one denial -- higher than about a third of white mortgage buyers (31%).9Households of color can be less likely to benefit from intergenerational wealth, and Black and Latinx households also typically have lower household wealth. And even for households of color that do become homeowners, many of the inequalities rooted in segregation and redlining persist today. Less money in the bank and lower home values can translate to less ability to offer a competitive down payment. Beyond the challenges that mortgage buyers of color face in regards to wealth, people of color more generally can face discrimination on the basis of race. The Zillow Housing Aspirations Report -- a survey of households in 20 major metropolitan areas -- found that households of color were significantly more likely to say that they were treated differently in their search for housing -- the case for 19% of Asian, 26% of Black, 16% of Latinx households, compared to just 3% of white households.
Despite Challenges and Competition, Buyers Held Strong on Inspections
Consistent with the past three years, buyers in 2021 didn’t budge significantly when it came to forgoing inspections: About one in nine (12%) said that they did not get an inspection on the property they bought prior to purchasing it -- insignificantly different from past years (13% in 2020, 13% in 2019, and 11% in 2018).
Buyers More Likely to Buy a Home with Plans to Renovate
While buyers did not report being any more likely to compromise on getting an inspection prior to finalizing their home purchase,10 buyers in 2021 were more likely to buy a home with the intention of renovating it, rather than doing smaller-scale repairs.
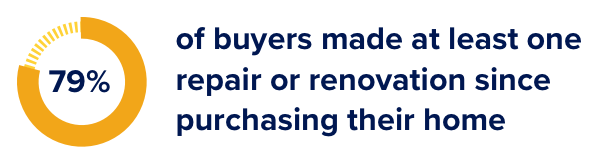
Most buyers complete at least one repair or renovation within the first year (79% made at least one since purchasing their home).11 This year, though, those buyers were more likely to say that their first project was a renovation that they planned since buying the home (31%, up from 21% in 2020). This shift coincided with a drop in the share that completed a planned repair -- down to 45% in 2021 from 54% in 2020. Given the competitive housing market, buyers may have been more likely to settle on homes in more need of full-on renovations, rather than smaller-scale repairs (for example, renovating an entire kitchen rather than repairing/replacing an oven).
Unexpected or surprise repairs, though, stayed consistent: Buyers that completed a repair within the first year of their home purchase were similarly likely to report an unexpected repair in 2021 (22%) as they were in 2020 (23%).
Most Buyers Changed Neighborhoods, but Stayed Local
When asked how far they moved, the largest share of buyers (39%) said they stayed in the same city, but changed neighborhoods. About one in ten (10%) reported staying in the same neighborhood. The smallest share (1%) moved from abroad.
| Distance Moved | 2019 | 2020 | 2021 |
|---|---|---|---|
| Same neighborhood | 15% | 17% | 10% |
| Same city, different neighborhood | 40% | 36% | 39% |
| Same metro, different city | 18% | 17% | 19% |
| Same state, different metro | 15% | 15% | 16% |
| Same country, different state | 11% | 14% | 15% |
| Moved from abroad | 1% | 1% | 1% |
That is, about 68% of buyers stayed within the same metro area. Over time, this number has largely stayed stable (73% in 2019, 70% in 2020). The exception is a slight increase in the share of buyers that moved to a different state (11% in 2019, 14% in 2020, up to 15% in 2021), and a small decrease in the share that say they stayed in the same neighborhood (15% in 2019, 17% in 2020, down to 10% in 2021).
Home & Neighborhood Characteristics that Buyers Consider Highly Important
Importance of Staying on Budget Persists
When asked what home characteristics they are most likely to consider very or extremely important, buyers have consistently said that staying within their initial budget is highly important. The largest majority (84%) said so, tied with air conditioning (84%), and higher than all other home characteristics.
Preferred number of bedrooms was the runner-up, at 78%. Despite the rise of remote work with the COVID-19 pandemic, the high importance of buyers’ preferred number of bedrooms has held steady over the last few years. However, the high importance of a guest bedroom has inched upward.
Buyers were also more likely to consider ample storage very or extremely important -- 75%, up from 68% in 2020. Air conditioning also saw a notable jump, rising from 79% in 2020 to 84% in 2021. Preferred number of bathrooms, an en-suite bathroom, smart home capabilities, and a hot tub or pool, also show subtle increases since 2019.
| Share of Buyers that Consider Each Home Characteristic Very or Extremely Important | 2018 | 2019 | 2020 | 2021 |
|---|---|---|---|---|
| Was within my initial budget | 83% | 83% | 82% | 84% |
| Had air conditioning | 76% | 78% | 79% | 84% |
| Had preferred number of bedrooms | 78% | 76% | 77% | 78% |
| Had ample storage | 64% | 64% | 68% | 75% |
| Had preferred number of bathrooms | 70% | 67% | 72% | 74% |
| Had a floor plan / layout that fit my preferences | 68% | 67% | 72% | 73% |
| Offered off-street parking or a garage | 70% | 64% | 68% | 73% |
| Had private outdoor space (e.g. patio, deck, yard) | 70% | 67% | 72% | 71% |
| Had good potential to increase in value | 67% | 64% | 67% | 71% |
| Had my preferred size / square footage | 69% | 67% | 69% | 70% |
| Had an en-suite or master bathroom | 62% | 60% | 64% | 69% |
| Was energy efficient | 56% | 56% | 62% | 67% |
| Had a spare or guest bedroom | 60% | 59% | 63% | 66% |
| Had preferred utilities (e.g. gas, electric) | 61% | 62% | 67% | 66% |
| Had my preferred style of kitchen | 58% | 57% | 63% | 63% |
| Offered me my own assigned parking place | - | 58% | 62% | 62% |
| Had my preferred finishes (e.g. flooring, countertops, appliances) | 53% | 52% | 58% | 58% |
| Had 'smart home' capabilities (e.g. with lighting, heating, and electronic devices that can be controlled remotely by smartphone or computer) | 27% | 27% | 35% | 40% |
| Offered shared community amenities (e.g. clubhouse, fitness center, playground) | 29% | 31% | 37% | 37% |
| Had a hot tub or pool | 24% | 25% | 30% | 35% |
| Opportunity to rent out entire home in the future to produce rental income | 27% | 28% | 33% | 34% |
| Opportunity to rent out a portion of the home for rental income while living in the home | 24% | 24% | 31% | 31% |
Importance of Neighborhood Characteristics Hold, Mostly
Despite a rise in working from home, buyer preferences regarding location and neighborhood remain largely unchanged. Buyers are similarly likely to consider most highly important as they were in the previous three years. The main exception is the importance of a sense of community or belonging, which has consistently increased since 2018 -- from 47% to 54% in 2021.
| Share of Buyers that Consider each Neighborhood Characteristic Very or Extremely Important | 2018 | 2019 | 2020 | 2021 |
|---|---|---|---|---|
| Close to family and/or friends | 47% | 46% | 50% | 50% |
| Close to shopping, services, and/or leisure activities | 54% | 53% | 58% | 56% |
| Close to public transportation | 30% | 30% | 36% | 36% |
| My commute to work or school | 54% | 52% | 53% | 51% |
| In a walkable neighborhood | 58% | 60% | 66% | 64% |
| Offered a sense of community or belonging | 47% | 48% | 51% | 54% |
Importance of Virtual Home Tours Rises, Along with Desire for (Digital) Floor Plans
Buyer Desire for (Digital) Floor Plans Remains High

Consistent with results in 2020, majorities of buyers in 2021 continue to agree at least somewhat with a series of statements on their desire for floor plans. While buyers continue to agree that they’re more likely to view a home if the listing includes a floor plan they like (81%), they are also similarly likely to agree that the only way to really understand the layout of a home is to see it in person (78%). The high agreement with both statements likely shows that most buyers want all the information they can get when searching for a home: Floor plans to help decide which homes to tour and an in-person visit for the homes with floor plans that fit their preferences.
| Share that agree somewhat/completely with each statement | 2020 | 2021 |
|---|---|---|
| I wasted time during my home search viewing properties that I would have skipped if I had understood their floor plan before my visit | 54% | 56% |
| I'm more likely to view a home if the listing includes a floor plan that I like | 79% | 81% |
| The only way to really understand the layout of a home is to see it in person | 76% | 78% |
| A dynamic floor plan that shows what part of the home each photo depicts would help me determine if the home is right for me | 71% | 74% |
Desire for 3D/Virtual Tours Remains High & Growing
Buyers in 2021 grew more likely to agree somewhat or completely with a series of statements on their preference for 3D and virtual tours -- passing their already increased numbers in 2020. The largest increases were their agreement that 3D tours would help them get a better feel for the space than static photos (68% in 2021, up from 62% in 2020) and the share that agreed that they wish more listings had 3D tours available (61% in 2021, up from 55% in 2020).
| Share of buyers that agree somewhat/completely with each statement | 2019 | 2020 | 2021 |
|---|---|---|---|
| 3D tours would help me get a better feel for the space than static photos | 52% | 62% | 68% |
| I wish more listings had 3D tours available | 46% | 55% | 61% |
| I prefer 3D tours over in-person viewings | 26% | 35% | 38% |
| I prefer to schedule in-person tours online | - | 57% | 61% |
| It would be easier for me to unlock properties with my phone and tour them in-person on my own time | - | 59% | 63% |
Confidence Making an Offer Without an In-Person Viewing Creeps Up
The share of buyers that say they would be at least somewhat confident making an offer on a home after seeing a 360/virtual tour, but not an in-person viewing, increased slightly from 55% in 2020 to 58% in 2021. The share that says they would be very or extremely confident has stayed around a third -- 32% in 2020 and a similar 34% in 2021.
| Buyer confidence making an offer on a home where they saw a 360/virtual tour, but did not view the home in person | 2020 | 2021 |
|---|---|---|
| Very/Extremely Confident | 32% | 34% |
| Somewhat Confident | 23% | 25% |
| Not at all/Not very Confident | 45% | 42% |
Almost All Buyers Took a Private Tour, Most Attend At Least One Open House
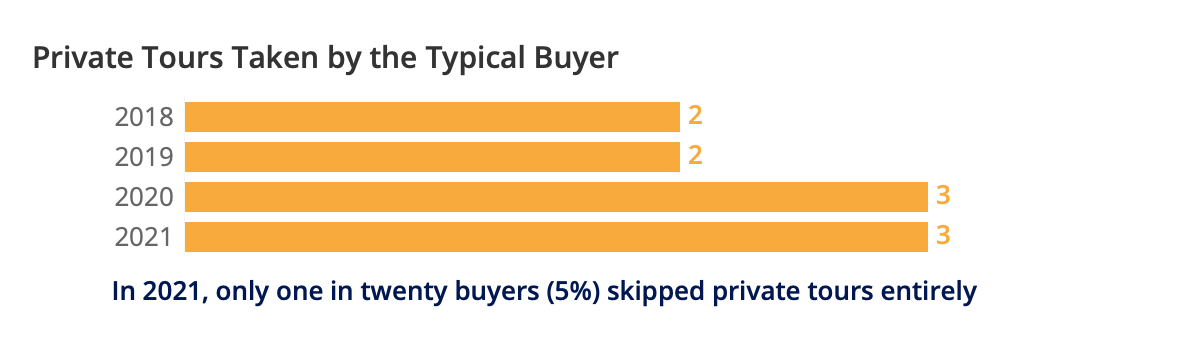
Despite the pandemic, the typical buyers surveyed in both 2020 and 2021 went on three private tours -- one more than the typical buyer in 2018 and 2019. And in 2021, only one in twenty buyers (5%) skipped private tours entirely.
| Share of Buyers that Reported Taking | 2018 | 2019 | 2020 | 2021 |
|---|---|---|---|---|
| 0 Private Tours | 11% | 11% | 9% | 5% |
| 1-4 Private Tours | 65% | 63% | 59% | 67% |
| 5 or More Private Tours | 24% | 26% | 31% | 27% |
| Median number of private tours | 2 | 2 | 3 | 3 |
About a third of buyers (34%) attended zero open houses and only one in ten (10%) attended 5 or more. Across 2018-2021, the median number of open houses remained only one tour.
| Share of Buyers that Reported Attending | 2018 | 2019 | 2020 | 2021 |
|---|---|---|---|---|
| 0 Open Houses | 45% | 41% | 35% | 34% |
| 1-4 Open Houses | 44% | 43% | 48% | 56% |
| 5 or More Open Houses | 12% | 15% | 17% | 10% |
| Median number of open houses | 1 | 1 | 1 | 1 |
1Buyers were asked about their home’s square footage in ranges.
n2Zillow Group Population Science defines Gen Z as those born between 1995 and 2003, Millennials between 1980 and 1994, Gen X between 1965 and 1979, Baby Boomers between 1945 and 1964, and Silent Generation in 1944 and earlier.
n3LGBTQ+ buyers are those who identified as gay, lesbian, bisexual, transgender, gender non-conforming/non-binary, intersex, or with another sexual orientation (other than straight) or gender identity (e.g. gender fluid, gender queer, gender neutral).
n4National median income is from U.S. Census Bureau, 2019 American Community Survey.
n5These estimates come from CHTR 2021 and the 2019 American Community Survey.
n6This trend, albeit less extreme, is reflected in Zillow’s internal transaction data. Zillow internal transaction data show that the share of home transactions in the first half of 2020 were about 15% non-single-family detached houses, growing to 17% in the same period in 2021. Self-reported home type data from the U.S. Census Bureau American Community Survey as well as the Zillow Consumer Housing Trends Report have historically shown a smaller share of buyers purchasing single-family detached houses than sales transaction data. It is possible that, given this difference between self-reported survey data and transaction data, survey results overestimate the magnitude of the shift.
n7About one in twenty (6%) buyers made zero offers. These buyers are more likely to purchase mobile or manufactured homes, transact without an agent, and consider the area where they purchased as rural.
n8Self-reported mortgage denials appear to skew much higher than denials in Home Mortgage Disclosure Act (HMDA) data (34% of successful mortgage buyers self-reporting in 2021 vs. 14% of all applicants in the most recent HMDA data from 2019). HMDA data includes all mortgage applicants -- not just successful mortgage buyers. It is also possible that survey respondents overreport cases where hurdles like providing relevant documents or poor communication/customer service from a lender caused financing to fall through -- without receiving a formal denial. While mortgage buyers may systematically overreport hurdles or roadblocks as denials, the significant increase between 2021 and the three prior years nonetheless reveals the increasing difficulty for mortgage buyers to get home financing.
n9For additional Zillow research on mortgage denials and race/ethnicity, see this post.
n10Buyers surveyed in 2021 were similarly likely to report getting an inspection on the home prior to purchase. Because CHTR is a nationally representative survey, it is possible that a consistent trend at the national level washed out potential shifts in especially competitive markets. The survey asked buyers if they got an inspection prior to finalizing their purchase, but not whether their offer included an inspection contingency. Future research on buyers in select markets and sellers will explore more deeply both of these “blind spots” in this report’s research on buyers.
n11This share could increase: CHTR surveys homeowners who bought their home in the last 12 months, and additional buyers will likely complete renovations within the first year.
Sign up for Zillow Research updates
Subscribe to receive weekly emails for the latest Zillow research, weekly housing data, market insights and more.
Related Articles




Research in your inbox
Get the latest housing data and analysis from Zillow's economists — delivered when the numbers update.

