How Much Home Has $1 Bought Over Time?
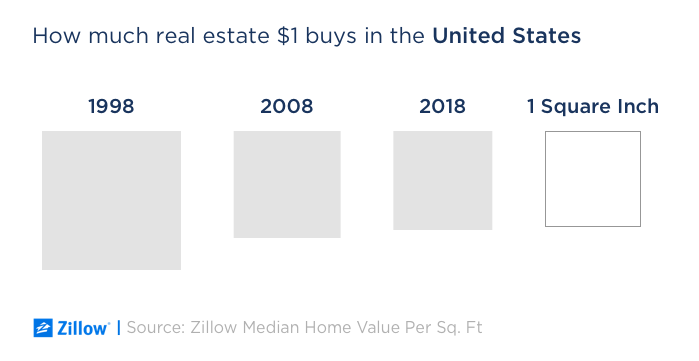
A dollar buys 1.1 square inches of the typical U.S. home -- but how has that changed over time?

A dollar buys 1.1 square inches of the typical U.S. home -- but how has that changed over time?
A dollar buys 1.1 square inches of the typical U.S. home — but how has that changed over time?
Here’s a graphic look at the answer, which is that a decade ago, a dollar bought 1.2 square inches and in 1998, 2.1 square inches.
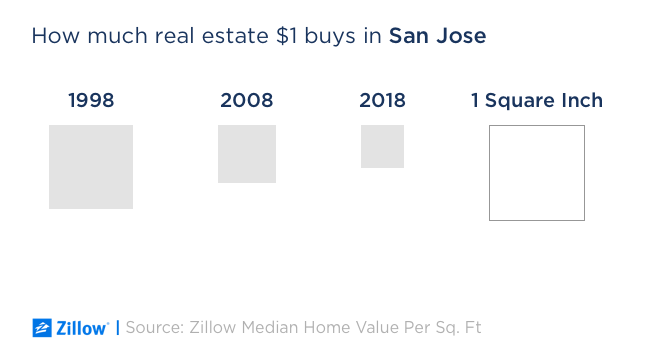
In pricey San Jose, Calif., a dollar now buys just 0.2 of a square inch of a home. But 10 years ago, it would buy 0.37 of a square inch and in 1998 — the year Google was founded — a dollar bought 0.76 of a square inch.
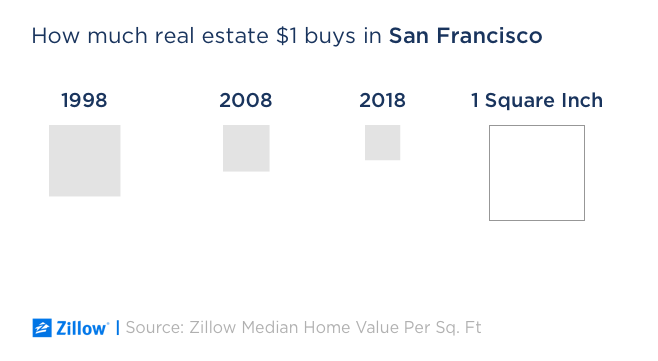
San Francisco has a similar trajectory: A dollar currently buys 0.14 of an inch of home there — the least space among major cities — down from 0.24 of an inch in 2008 and 0.56 of an inch in 1998.
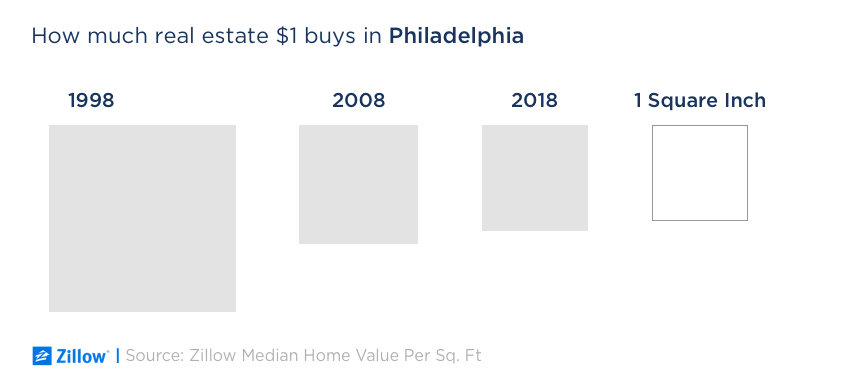
The amount of space for a dollar in Philadelphia is now just above the U.S., at 1.22 inches — down from 1.55 in 2008 and a luxurious 3.79 inches in 1998.
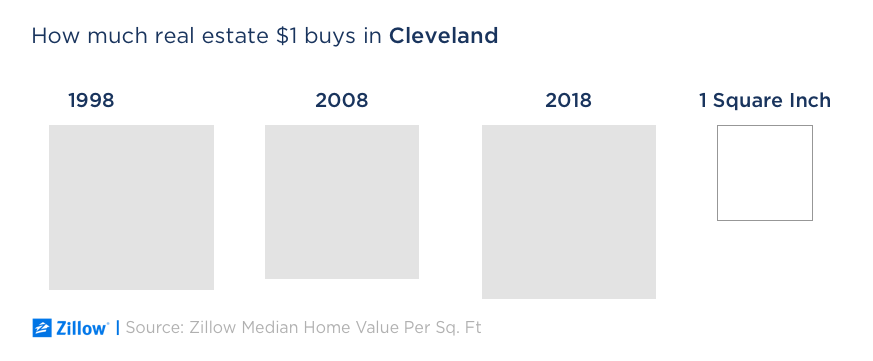
Cleveland has gone the other direction in recent years. Currently, a buyer of a median-valued home in Cleveland would get 3.27 inches for the dollar — up from 2.57 inches in 2008 and from 2.94 inches in 1998.
Here are the numbers for the 35 most populous cities (which does not include Cleveland):
| City | Zillow Home Value Index[i] (ZHVI) | YoY ZHVI Change | Square Inches for $1 in 1998 | Square Inches for $1 in 2008 | Square Inches for $1 in 2018 |
| United States | $218,000 | 8.0% | 2.09 | 1.23 | 1.07 |
| New York | $672,200 | 6.4% | 1.01 | 0.38 | 0.28 |
| Los Angeles | $674,800 | 7.2% | 1.18 | 0.43 | 0.31 |
| Chicago | $225,600 | 2.1% | 1.58 | 0.74 | 0.85 |
| Houston | $179,400 | 7.0% | 2.57 | 1.95 | 1.40 |
| Philadelphia | $150,300 | 11.4% | 3.79 | 1.55 | 1.22 |
| Phoenix | $232,700 | 9.0% | 2.25 | 1.12 | 0.95 |
| Las Vegas | $262,200 | 15.4% | 1.82 | 1.08 | 0.94 |
| San Antonio | $168,600 | 8.1% | 2.62 | 1.89 | 1.37 |
| San Diego | $623,000 | 6.5% | 1.13 | 0.50 | 0.34 |
| Dallas | $194,100 | 13.8% | 2.48 | 1.80 | 1.04 |
| San Jose | $1,110,800 | 23.5% | 0.76 | 0.37 | 0.20 |
| Jacksonville | $166,500 | 10.3% | 2.67 | 1.44 | 1.35 |
| San Francisco | $1,366,000 | 9.2% | 0.56 | 0.24 | 0.14 |
| Indianapolis | $130,700 | 10.9% | 2.18 | 1.85 | 1.67 |
| Austin | $350,200 | 7.9% | 1.43 | 1.15 | 0.73 |
| Fort Worth | $185,200 | 10.4% | 2.62 | 2.09 | 1.36 |
| Columbus | $147,000 | 9.0% | 2.00 | 1.62 | 1.27 |
| Memphis | $83,300 | 8.3% | 3.13 | 2.88 | 2.53 |
| Charlotte | $213,400 | 11.0% | 2.03 | 1.58 | 1.21 |
| El Paso | $124,200 | 3.7% | 2.72 | 1.78 | 1.69 |
| Boston | $588,000 | 6.3% | 1.01 | 0.46 | 0.26 |
| Seattle | $753,600 | 8.1% | 1.03 | 0.47 | 0.28 |
| Baltimore | $117,100 | 33.2% | 2.88 | 1.21 | 1.33 |
| Denver | $416,100 | 7.6% | 1.33 | 0.79 | 0.41 |
| Washington | $569,100 | 5.0% | 1.33 | 0.41 | 0.28 |
| Nashville | $256,700 | 10.1% | 2.12 | 1.47 | 0.92 |
| Milwaukee | $114,800 | 10.6% | 2.40 | 1.33 | 1.50 |
| Tucson | $ 181,000 | 7.5% | 2.18 | 1.16 | 1.19 |
| Portland | $424,700 | 0.9% | 1.47 | 0.73 | 0.48 |
| Oklahoma City | $126,400 | 2.3% | 3.51 | 2.12 | 1.71 |
| Omaha | $167,900 | 7.6% | 1.92 | 1.53 | 1.15 |
| Albuquerque | $194,300 | 6.2% | 1.76 | 1.07 | 1.06 |
| Fresno | $231,700 | 7.1% | 2.40 | 1.07 | 0.97 |
| Sacramento | $318,900 | 7.3% | 1.97 | 0.97 | 0.65 |
| Mesa | $240,200 | 7.8% | 2.09 | 1.19 | 0.96 |
[i] The Zillow Home Value Index (ZHVI) is the median estimated home value for a given geographic area on a given day and includes the value of all single-family residences, condominiums and cooperatives, regardless of whether they sold within a given period. It is expressed in dollars, and seasonally adjusted.
