Almost 1 in 5 homeowners are considering selling in the next three years

Written by Treva Tam on January 29, 2025
- 19% of homeowners currently have their home listed for sale or are considering selling their home within the next three years.
- 11% of mortgaged homeowners have a rate above 6%. This is almost double the percentage of that two years ago (6%of mortgaged homeowners in Q4 2022).
- Homeowners’ reasons for considering a move (or not considering a move) within the next 3 years remain relatively unchanged over the past year.
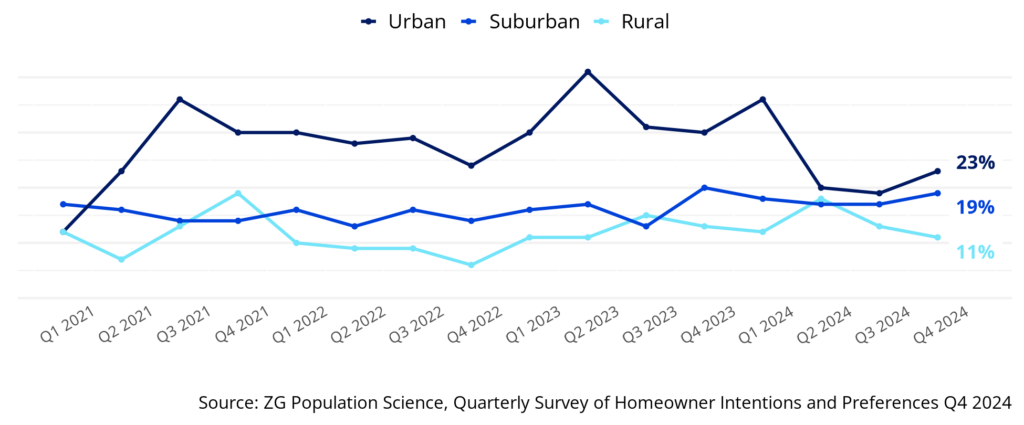
- Continuing last quarter’s trend, the share of urban homeowners intending to sell remains lower than in 2023.
- 23% of urban homeowners intend to sell in the next three years compared to 29% a year ago (Q4 2023).
- Suburban and rural intentions to sell remained steady between 2023 and 2024.
Selling Intentions
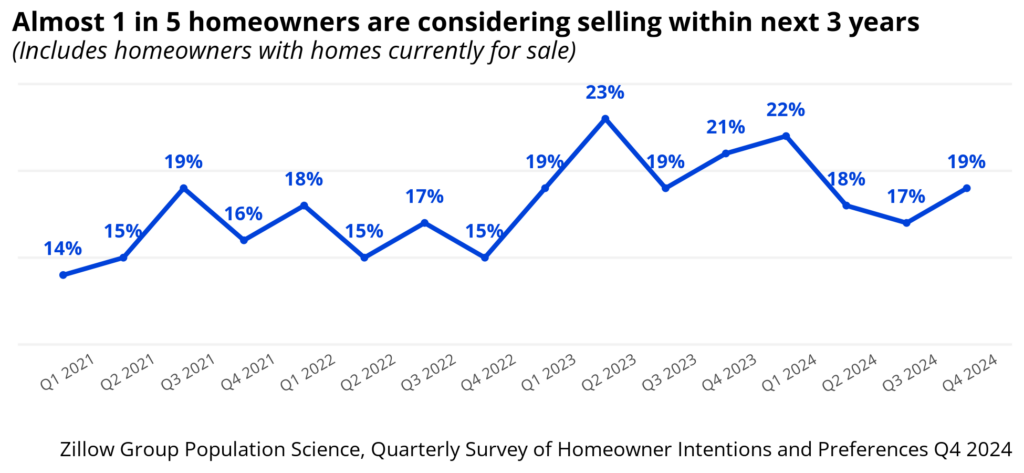
19% of homeowners are considering selling within the next three years. This share of selling intentioned homeowners has decreased from the larger proportions (above 20%) seen through 2023 and the first half of 2024. However, the proportions remain relatively larger than seen in 2021 and 2022.
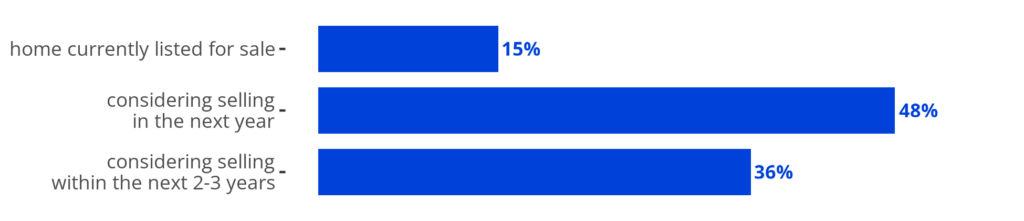
About 19% of homeowners say they are considering selling their home within the next three years or said their home is currently listed for sale. Of this selling-intentioned group:
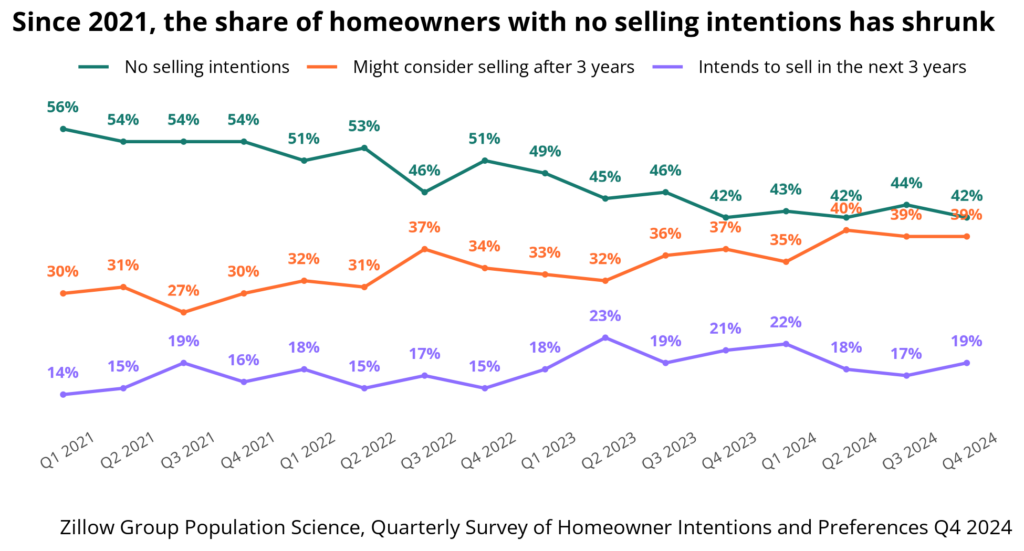
Since 2021, the proportion of homeowners with no selling intentions at all, neither in the next three years nor after, has shrunk. In 2021 and 2022, more than half (> 50%) of homeowners intended to decidedly stay in place. 56% of homeowners had no plans to sell in Q1 2021, this quarter (Q4 2024) 42% of homeowners had no plans to sell. The past year, the proportion of homeowners with no selling intentions has hovered around the low-40 percent.
Regional differences
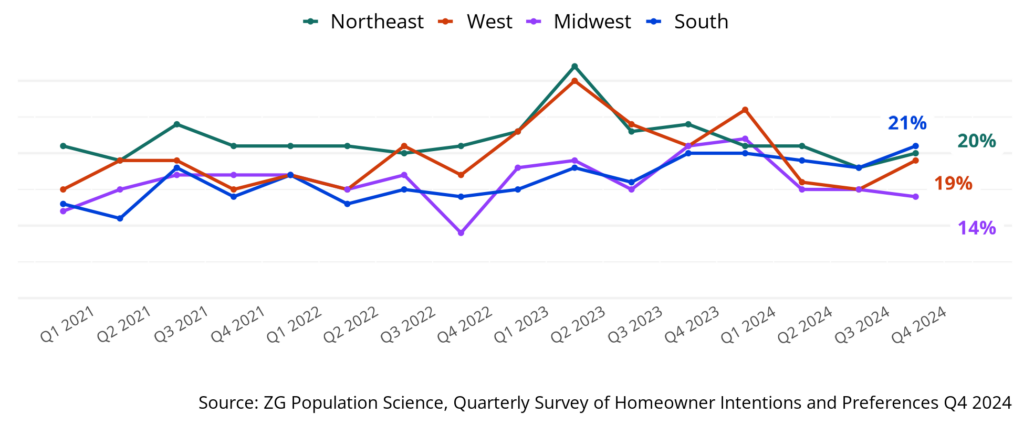
The proportion of selling-intentioned homeowners has fluctuated quarter to quarter since 2021, though the South has seen a gradual increase of selling intentions over four years. This December 2024, 21% of Southern homeowners plan to sell in the next three years, 20 % of Northeastern homeowners, 19% of Western homeowners, and 14% of those in the Midwest. These shares, however, are statistically similar across regions when accounting for regional demographic differences.1
Urbanicity
Continuing the trend from last quarter, the share of urban homeowners intending to sell remains lower than in 2023 at 23% (compared to 29% a year ago in Q4 2023). 19% of suburban homeowners and 11% of rural homeowners have intentions to sell in the next three years.
Mortgaged Homeowners and Selling Plans
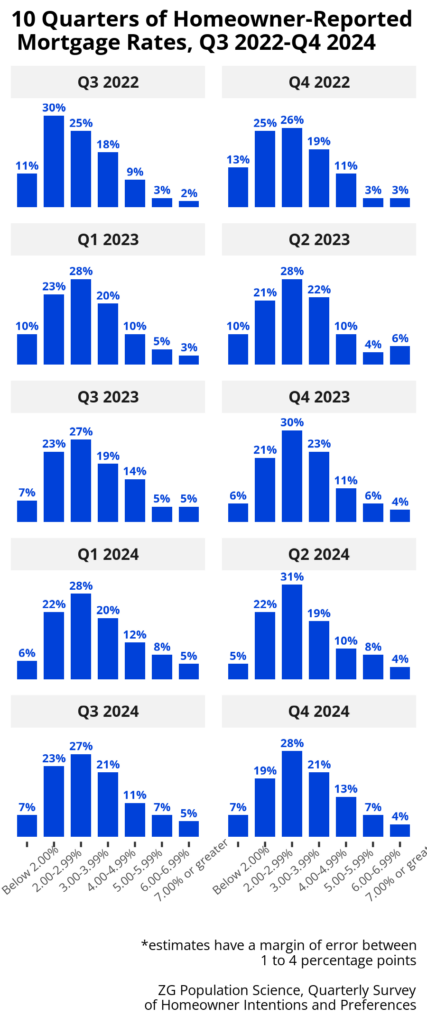 Over the past ten quarters,3 the distribution of homeowner-reported mortgage rates has remained relatively similar.
From 2021 to 2023, 30-year fixed-rate mortgage rates surged from 3% to nearly 8%, peaking at approximately 7.8% in October 2023 — the highest in two decades. In 2024, rates fluctuated between 6% and 7%, far from the low 2% and 3% mortgages seen right after the COVID-19 pandemic.
The rise in rates is evident here. In Q3 2022, the largest share (30%) of mortgaged homeowners held a rate between 2 and 2.99%, and only 5% had a rate above 6%. Less than a year later, the share of 2-2.99% homeowners dropped to 21% while above 6%-mortgaged homeowners doubled to 10% by Q2 2023. As mortgage rates remain high, the share of homeowners holding rates of 5% or higher will only continue to grow.
Currently (Q4 2024), 89% of mortgage holders reported having a mortgage rate less than 6.00%, 75% reported a rate less than 5.00%, and 26% reported a rate less than 3.00%.
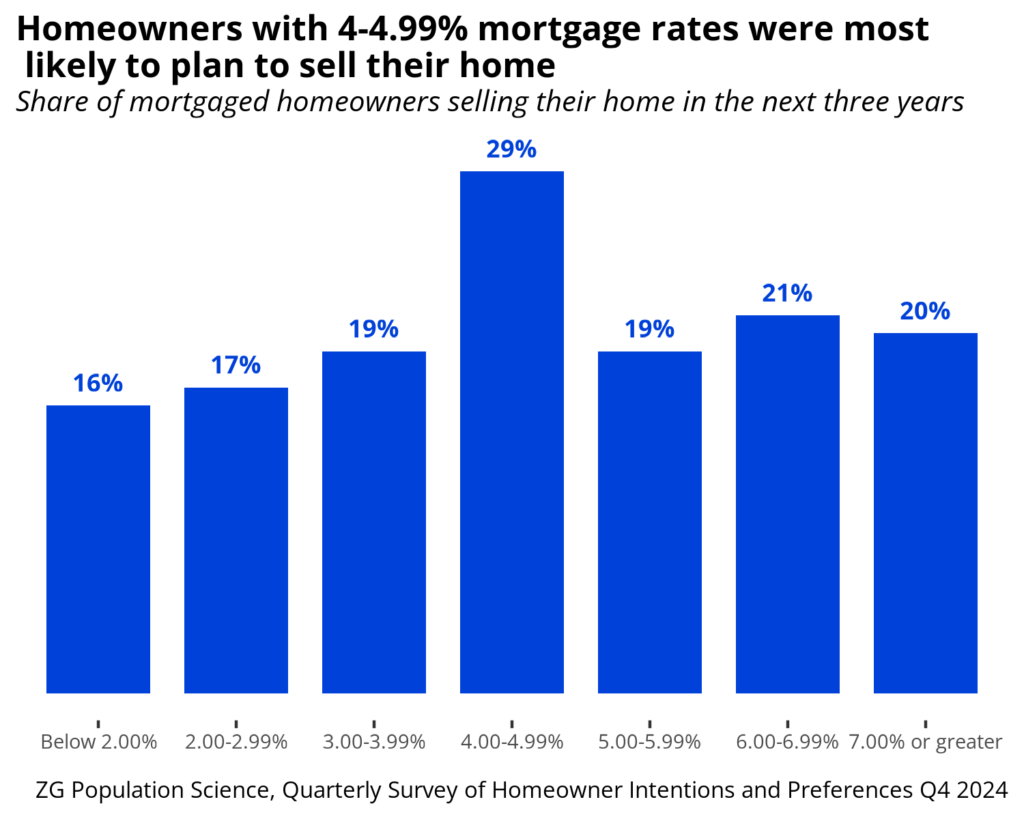
We found that this quarter, mortgaged homeowners with rates between 4-4.99% were the most likely to report plans to sell their home in the next three years.2
Reasons for Selling
Similar to last quarter, a desire for an upgraded space with changed features, changing family structures, and selling for financial profit were among the main reasons for selling.
Of homeowners considering selling within the next 3 years:
- 55% said their desire for an upgraded home with nicer features influenced their decision.
- Potential sellers are also potential buyers: 56% said they found other homes that they prefer over their current one.
- Almost half (49%) said they plan to sell their home for a profit or use the equity for another purpose.
- A significant share of selling-intentioned homeowners believe the housing market now will be more beneficial to them than that in the future.
- 39% think they’ll get a better deal on a new home now than in the future.
- 45% think they’ll be able to sell their home for more money now than in the future
- Changing family structure influences homeowners’ decisions to sell.
- 34% cited that the size of their household getting larger
- 41% cited the size of their household getting smaller
| Reasons to Sell | This Quarter n(Q4 2024) | Last Quarter n(Q3 2024) | Last Year n(Q4 2023) |
|---|---|---|---|
| New Home Needs & Characteristics | |||
| Want a home with upgraded or more desirable features | 55% | 52% | 55% |
| Don’t want to be responsible for repairs/maintenance | 32% | 32% | 37% |
| Want more outdoor space | 51% | 42% | 44% |
| I want home office space | 28% | 26% | 33% |
| My home no longer fits my health needs | 26% | 29% | 31% |
| I found other homes that I prefer over my current home | 56% | 48% | 50% |
| I want to change the current layout or floor plan of my house | 49% | 42% | 53% |
| Family Structure | |||
| The size of my family/household is getting larger | 34% | 23% | 31% |
| The size of my family/household is getting smaller | 41% | 43% | 40% |
| I had a recent life change (e.g. got married, got divorced, had a baby) | 33% | 30% | 32% |
| Financial | |||
| To sell the home for a profit or use the equity for another purpose | 49% | 50% | 47% |
| I think I’ll get a better deal on a new home now than in the future | 39% | 32% | 37% |
| I think I’ll be able to sell my home for more money now than in the future | 45% | 39% | 39% |
| I can no longer afford my home | 24% | 17% | 23% |
| Changing Locations | |||
| I want to live closer to family | 42% | 30% | 36% |
| Reduce commuting time | 27% | 22% | 31% |
| I want to live around people who share my values | 31% | 30% | 36% |
| I want to live in an area that share my politics | 27% | 19% | 26% |
| Move to a school district that is a good fit | 21% | 17% | 27% |
Housing Market Influences
Housing market characteristics had a larger influence on selling intentions than last quarter. 75% of selling-intentioned homeowners reported at least one change in the current housing market as an influence for their decision to sell in the next three years.
Notable changes from last quarter are increases in homeowners who sold because of lowering home prices (25% last quarter to 34% in Q4 2024), recent changes in mortgage interest rates (29% to 40% in Q4 2024), and less competition for homes (21% to 32% in Q4 2024). These characteristics are typically indicators of a favorable market for homebuying, suggesting that homeowners who are considering selling are also weighing the conditions for buying a new home as well.
| Housing Market influences | This Quarter n(Q4 2024) | Last Quarter n(Q3 2024) | Last Year n(Q4 2024) |
|---|---|---|---|
| Cited one or more housing market reasons | 75% | 66% | 67% |
| Lowering home prices | 34% | 25% | 31% |
| Increasing home prices | 39% | 49% | 43% |
| Recent changes in mortgage interest rates | 40% | 29% | 38% |
| Less competition for homes | 32% | 21% | 26% |
| More competition for homes | 37% | 35% | 40% |
Reasons for Not Selling
81% of homeowners have no plans to sell in the next three years. Of these, 48% might consider selling after three years (vs. 52% who have no plans to sell at all). We asked these homeowners about their reasons for not currently selling.
| Reasons Not to Sell | This Quarter n(Q4 2024) | Last Quarter n(Q3 2024) | Last Year n(Q4 2023) |
|---|---|---|---|
| My Current Home | |||
| I love my current home | 73% | 66% | 65% |
| I am planning or completing a home renovation (or just completed) | 37% | 30% | 34% |
| Financial | |||
| I won’t be able to find and/or afford a new home | 44% | 45% | 44% |
| My current financial situation is uncertain or precarious | 35% | 33% | 28% |
| I anticipate a more favorable home sale price if I wait | 44% | 42% | 44% |
| I recently refinanced my home/mortgage | 19% | 18% | 17% |
| My mortgage payments are paused or reduced | 16% | 14% | 15% |
| Family Needs | |||
| Life is too uncertain for me and/or my household | 39% | 33% | 37% |
| I am concerned about my health or a family member’s health | 31% | 20% | 24% |
| My children or other family members have moved back in with me | 23% | 16% | 19% |
The percentages for reasons not to sell in the next three years have remained fairly stable. Loving their current home (73%) remains the biggest reason these homeowners have no plans to sell in the next three years.
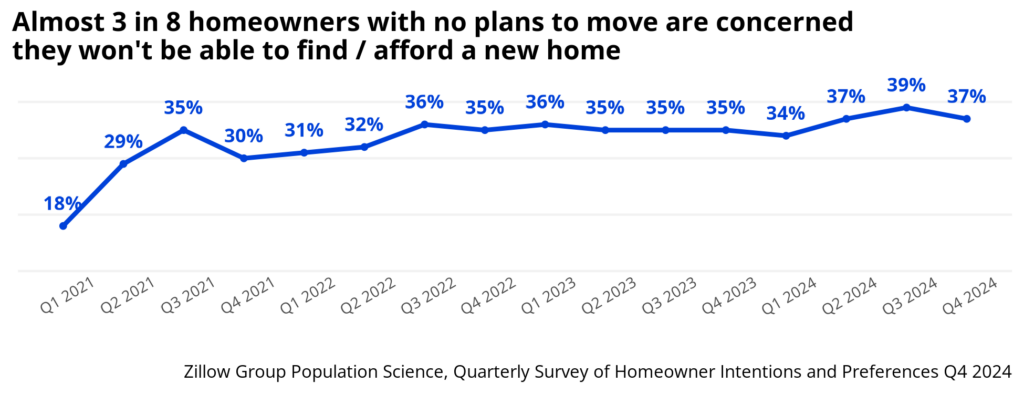
Of homeowners who have no plans at all to sell even after three years, about 3 in 8 (37%) cite a concern about the ability to find or afford a new home as a reason for not moving. This share has remained similar since Q3 2021.
What’s Next?
Long4- & Short5- Distance Moves
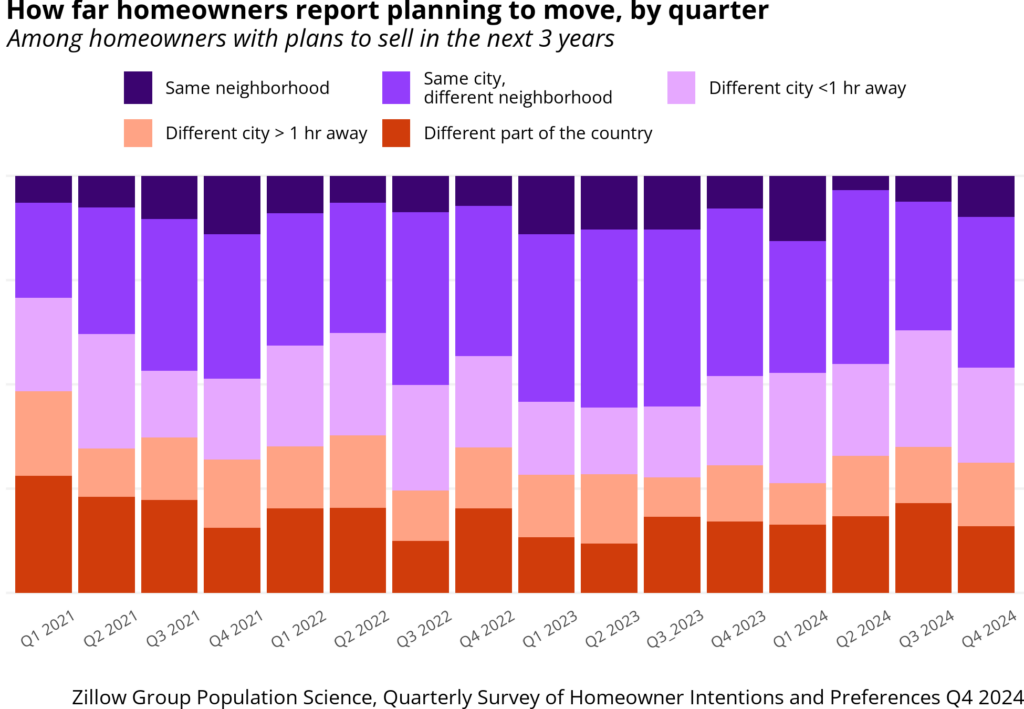
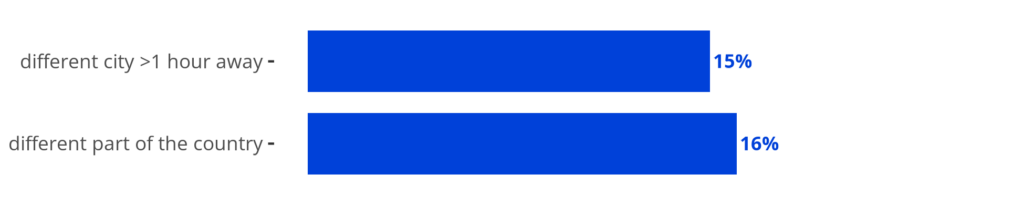
The share of homeowners planning a distance move versus a local move has waxed and waned. In December 2024, 31% of selling-intentioned homeowners planned (or are planning) a long-distance move, while 69% are planning a short-distance move.
Compared to the average homeowner, urban homeowners are more likely to plan on moving closer to their current home: 77% of urban homeowners plan to move short-distance, while 23% plan to move long-distance.
About 1 in 3 (31%) homeowners with plans to sell are planning a long-distance move.
Among homeowners with plans to sell in the next 3 years, about 5 in 8 (62%) anticipate spending at least as much as they expect to make from selling their current home on their next home. This is significantly increased from last quarter (54%).
Market Confidence
Confidence in Selling
Large majorities of current homeowners remain confident in both their ability to sell within their preferred time frame and sell for a profit.
- 91% of homeowners said they are somewhat, quite, very, or almost completely confident they could sell their home within their preferred time frame if they listed it for sale.
- 94% said they are somewhat, quite, very, or almost completely confident they could sell their home for a profit if they listed it for sale.
In other words, homeowners are confident they can sell on their timeline and for a profit in this market. Market confidence, as measured by both of these metrics in QSHIP, has not changed appreciably since 2022.
General Housing Confidence
The general population particularly sees it as a bad time for home buying (86%) though less so for home selling (41%).6
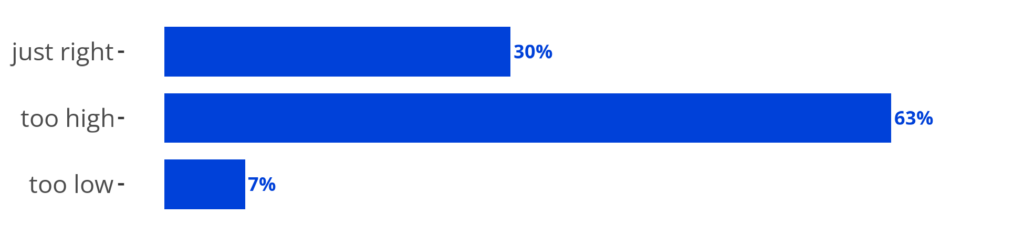
Housing prices vs. Fair value
When asked to compare current home prices to their fair market value, homeowners said prices were:
Methodology
These analyses use data from the ZG Population Science Quarterly Survey of Homeowner Intentions and Preferences (QSHIP), which explores homeowners intentions to sell their home and move, their reasons for moving or not moving, and their perceptions on the current housing market. Fielded quarterly since the first quarter of 2021, QSHIP employs a repeated cross-sectional design to measure within- and between-year change.
Homeowners 18 years of age and older who did not move within the last 12 months were eligible for participation. The current survey wave (Q4 2024) was fielded during the first two weeks of December 2024 and included 1,788 homeowner respondents.
To achieve national representativeness, quotas for age, education, sex, region, race, and marital status limited oversampling of any given demographic group. In addition to using quotas for respondent sampling, ZG Population Science weighted the sample to the overall U.S. population using the U.S. Census Bureau 2022 Current Population Survey Annual Social and Economic Supplement (CPS ASEC) using these same characteristics. See earlier QSHIP briefs for methodological details for earlier data points.
[1] Regression-based analysis shows that regional differences in intentions to sell disappear when accounting for regional age, race/ethnicity, urbanicity, education, and income differences.
n[2] Additional (regression-based) analyses show that urbanicity differences between urban and suburban disappear when accounting for differences in age, race/ethnicity, and region. Regional differences exist between urban and rural, however. In previous quarters, regional differences had persisted between all regions.
n[3] ZG PopSci only started asking homeowners’ mortgage rate information in Q3 2022 though the first survey was fielded in Q1 2021.
n[4] Long-distance move was defined as a move to a different city more than an hour away or to a different part of the country.
n[5] Short-distance was defined as a move to a home in the same neighborhood, the same city, or a different city less than an hour away.
n[6] Though these sentiments are lagged by a full quarter, i.e. based on Q3 2024 rather than Q4 2024.
Sign up for Zillow Research updates
Subscribe to receive weekly emails for the latest Zillow research, weekly housing data, market insights and more.
Related Articles




Research in your inbox
Get the latest housing data and analysis from Zillow's economists — delivered when the numbers update.

