Nearly 1 in 5 Homes Sell Within a Week
Homes that sell within seven days are 2.6 times more likely to sell above asking price
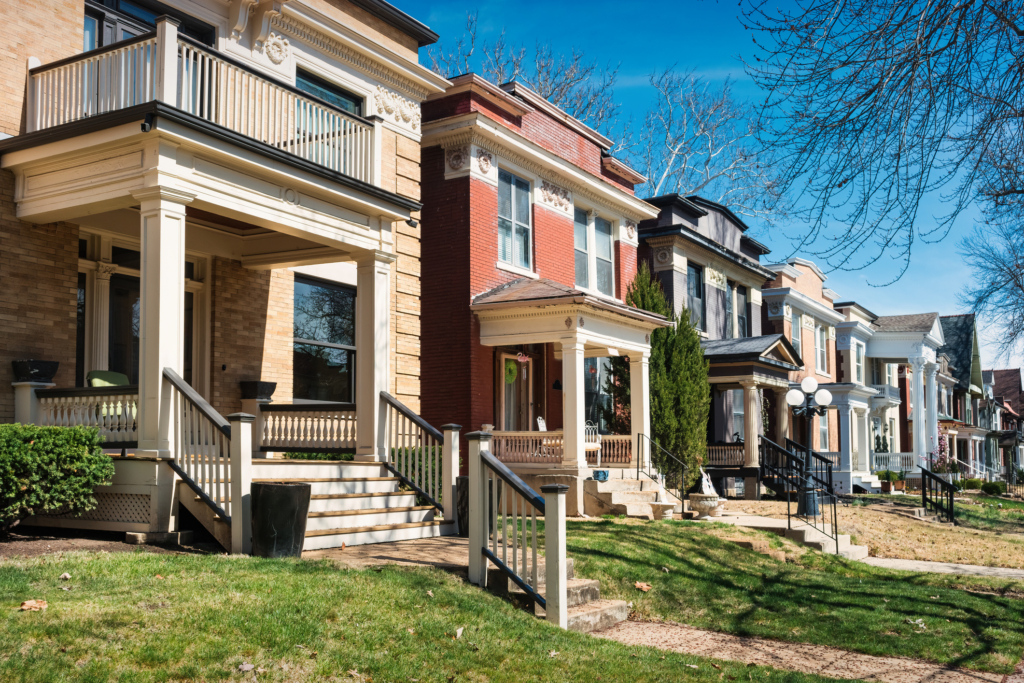
Homes that sell within seven days are 2.6 times more likely to sell above asking price
Key Findings
After years of lightning-fast home sales during the pandemic, the U.S. housing market is back to operating on two distinct tracks. Desirable, well-priced homes continue to sell quickly, though this group is shrinking. Other homes are lingering longer than they have in years. These numbers look similar to conditions before the pandemic, pointing to a housing market that is settling into its new normal.
The gap between how quickly sold homes move and how long all inventory sits reached its widest point for any March since 2020. In March, the typical home that sold went pending in 19 days, while the median age of all active listings was 56 days — a 37-day difference. That gap was as narrow as nine days in April 2022. The divide reflects a market where buyers have more choices and more leverage than they have had in years, and where homes that stand out are rewarded while others wait.
The cream of the crop is still selling quickly. Nationally, 18.5% of homes went pending within seven days in February 2026, the latest month with complete sales data. In the fastest markets — including St. Louis, Hartford and Seattle — more than a third of all homes sell that quickly.

Among those fast-selling homes, 44.3% sold above asking price, compared to just 17.1% of all homes, making homes that sold within a week 2.6 times more likely to have attracted a bidding war. That’s the second-highest such multiple in Zillow’s data going back to 2018.
The divergence between homes that sell fast and homes that linger reflects a return to a more balanced housing market. Challenging financial conditions have limited the pool of buyers, who are more choosy than during the pandemic. Yet, those buyers still in the market are benefiting from more options and bargaining power. Sellers whose listings check every box sell quickly, while others linger.
The divide plays out differently depending on where you look. Several Midwest markets — including St. Louis, Cincinnati and Kansas City — have at least 3 in 10 homes selling within seven days, where relative affordability has kept demand steady. Sun Belt markets where inventory has surged, including Austin, San Antonio, Charlotte and Jacksonville, have fewer than 1 in 10 homes selling that quickly. Buyers in these markets have far more options and less incentive to make an immediate offer.
| Metro Area* | Median Days to Pending (March 2026) | Median Age of All Active Listings (March 2026) | Share of Homes Sold Within 7 Days (February 2026) | Share of Homes Sold Within 7 Days That Sold Above List (February 2026) | Share of All Homes Sold Above List (February 2026) |
| United States | 19 | 56 | 18.5% | 44.3% | 17.1% |
| New York, NY | 25 | 49 | 5.6% | 53.4% | 33.9% |
| Los Angeles, CA | 18 | 40 | 14.4% | 56.1% | 32.3% |
| Chicago, IL | 8 | 26 | 25.0% | 58.5% | 24.7% |
| Dallas, TX | 25 | 52 | 13.6% | 36.5% | 9.6% |
| Houston, TX | 34 | 73 | 11.9% | 28.1% | 7.5% |
| Washington, DC | 7 | 24 | 33.5% | 62.1% | 28.1% |
| Philadelphia, PA | 9 | 27 | 28.2% | 60.7% | 29.2% |
| Miami, FL | 53 | 104 | 8.9% | 19.4% | 4.9% |
| Atlanta, GA | 33 | 59 | 8.6% | 36.1% | 12.7% |
| Boston, MA | 8 | 18 | 28.7% | 69.6% | 32.6% |
| Phoenix, AZ | 28 | 52 | 21.1% | 24.4% | 8.9% |
| San Francisco, CA | 13 | 20 | 17.6% | 79.6% | 55.0% |
| Riverside, CA | 26 | 55 | 12.4% | 48.9% | 23.8% |
| Detroit, MI | 12 | 40 | 22.8% | 61.7% | 23.9% |
| Seattle, WA | 9 | 26 | 34.7% | 58.1% | 25.4% |
| Minneapolis, MN | 18 | 27 | 11.5% | 68.0% | 22.9% |
| San Diego, CA | 15 | 33 | 19.2% | 59.0% | 31.5% |
| Tampa, FL | 36 | 69 | 16.3% | 29.9% | 8.2% |
| Denver, CO | 13 | 35 | 25.2% | 51.0% | 17.8% |
| Baltimore, MD | 8 | 27 | 30.4% | 62.8% | 29.7% |
| St. Louis, MO | 6 | 25 | 36.4% | 57.2% | 27.5% |
| Orlando, FL | 34 | 73 | 14.8% | 31.2% | 8.4% |
| Charlotte, NC | 18 | 48 | 8.0% | 43.5% | 12.6% |
| San Antonio, TX | 42 | 82 | 7.5% | 23.2% | 7.0% |
| Portland, OR | 12 | 40 | 27.4% | 59.3% | 23.2% |
| Sacramento, CA | 11 | 26 | 24.6% | 62.5% | 29.5% |
| Pittsburgh, PA | 11 | 48 | 22.3% | 47.1% | 16.3% |
| Cincinnati, OH | 6 | 27 | 33.1% | 37.9% | 17.4% |
| Austin, TX | 40 | 54 | 2.7% | 40.0% | 8.9% |
| Las Vegas, NV | 30 | 64 | 13.6% | 29.4% | 10.0% |
| Kansas City, MO | 5 | 24 | 33.3% | 55.1% | 23.1% |
| Columbus, OH | 6 | 26 | 30.3% | 47.7% | 19.8% |
| Indianapolis, IN | 13 | 35 | 22.3% | 32.7% | 11.4% |
| Cleveland, OH | 7 | 25 | 31.2% | 52.9% | 24.0% |
| San Jose, CA | 11 | 17 | 22.4% | 83.9% | 60.9% |
| Nashville, TN | 23 | 51 | 17.2% | 20.7% | 6.6% |
| Virginia Beach, VA | 23 | 33 | 9.4% | 48.9% | 25.4% |
| Providence, RI | 11 | 26 | 24.6% | 75.8% | 35.6% |
| Jacksonville, FL | 46 | 65 | 8.0% | 22.7% | 7.3% |
| Milwaukee, WI | 13 | 32 | 11.0% | 79.7% | 39.0% |
| Oklahoma City, OK | 25 | 58 | 21.2% | 31.5% | 12.3% |
| Raleigh, NC | 15 | 36 | 19.5% | 45.9% | 12.3% |
| Memphis, TN | 24 | 60 | 17.4% | 25.4% | 10.7% |
| Richmond, VA | 6 | 16 | 33.9% | 58.5% | 28.2% |
| Louisville, KY | 12 | 39 | 25.1% | 35.6% | 13.6% |
| New Orleans, LA | 38 | 91 | 12.8% | 26.0% | 5.4% |
| Salt Lake City, UT | 15 | 35 | 20.2% | 50.3% | 17.8% |
| Hartford, CT | 6 | 11 | 35.1% | 86.1% | 48.9% |
| Buffalo, NY | 10 | 16 | 14.6% | 78.6% | 41.8% |
| Birmingham, AL | 15 | 54 | 22.3% | 50.6% | 17.5% |
*Table ordered by market size