As the Senate considers the Housing Finance Reform and Taxpayer Protection Act of 2014—commonly known as the Johnson-Crapo Bill after its co-sponsors—policymakers are asking about the proposal’s potential impact on mortgage markets. In particular, some have expressed concern that the bill will exacerbate currently tight credit conditions for certain underserved or highly leveraged populations.
This Zillow Economics Research Brief uses data from the Zillow Mortgage Marketplace (ZMM)—an online platform that connects thousands of mortgage borrowers and lenders each day—as well as the Home Mortgage Disclosure Act (HMDA) database and the U.S. Census Bureau’s American Community Survey (ACS) to profile populations that are currently underserved or face high levels of debt.
I. A Profile of the Underserved
Estimating the number of eligible and interested borrowers is a near impossible task due to a lack of comprehensive national data that include the full range of variables that influence lending decisions.
Home Mortgage Disclosure Act (HMDA) data provide valuable information, including the outcome of every application for a home purchase loan. However, they lack the information to distinguish between loans denied for a legal cause—such as poor credit history—from those denied for illegal causes—such as race.[1] Other transactional data sets, such as data on loan requests and responses from the Zillow Mortgage Marketplace (ZMM), include information on credit history, income and leverage that is legally relevant to lending decisions, but lacks information on race or ethnicity. Both data sets include information on income and geography.
Further complicating this analysis is the reality that many of these legal and illegal reasons for mortgage lending outcomes are highly correlated, making attribution of outcomes to one or the other particularly difficult. Also missing are explanations for abandoned loan applications that could have resulted in a successful loan but for discouragement, changing circumstances, or other unknown possibilities. Moreover, we have little recourse to identify populations that did not file a mortgage application for any number of reasons—lack of information, advice or local banks and mortgage brokers who serve the market segment.
With these limitations in mind, we identify the underserved in two ways.
- First, we can define an underserved group as receiving a smaller share of home purchase loans relative to a national average or relative to some reference subgroup.
- Secondly, an underserved group can be identified as receiving relatively less interest from lenders, as quantified by the number of quotes from mortgage lenders.
For the first definition of underserved, we rely on original Zillow analysis of HMDA data; for the second, we use ZMM data.
A. Loan outcomes by income, race/ethnicity, and geography[2]
By comparing 2012 HMDA records of primary home purchase applications with findings drawn from U.S. Census Bureau’s American Community Survey one-year sample for 2012, we find that African Americans and Hispanics are underrepresented in the mortgage market. African Americans make up 12.3 percent of the total population, yet submitted only 6 percent of all applications for primary mortgage loans in 2012. There is also a drop for Hispanics: They compose 16.9 percent of the total U.S. population, but file only 9.4 percent of all primary mortgage loan applications. By contrast, whites are overrepresented in mortgage markets: They are 62.8 percent of the total population, but account for 64.8 percent of primary mortgage applications.
These discrepancies are exacerbated within the pool of applications for conventional mortgages (see chart below).[3] African Americans submit only 2.9 percent of the applications for conventional home loans and Hispanics submit only 5.4 percent. By contrast, whites submit 69.8 percent of conventional applications despite making up 62.8 percent of the total U.S. population. Because of higher denial rates among black and Hispanic applicants relative to white applicants, the racial/ethnic distribution of successful conventional mortgage applications—those that resulted in the origination of funds—further exacerbates these racial and ethnic disparities.
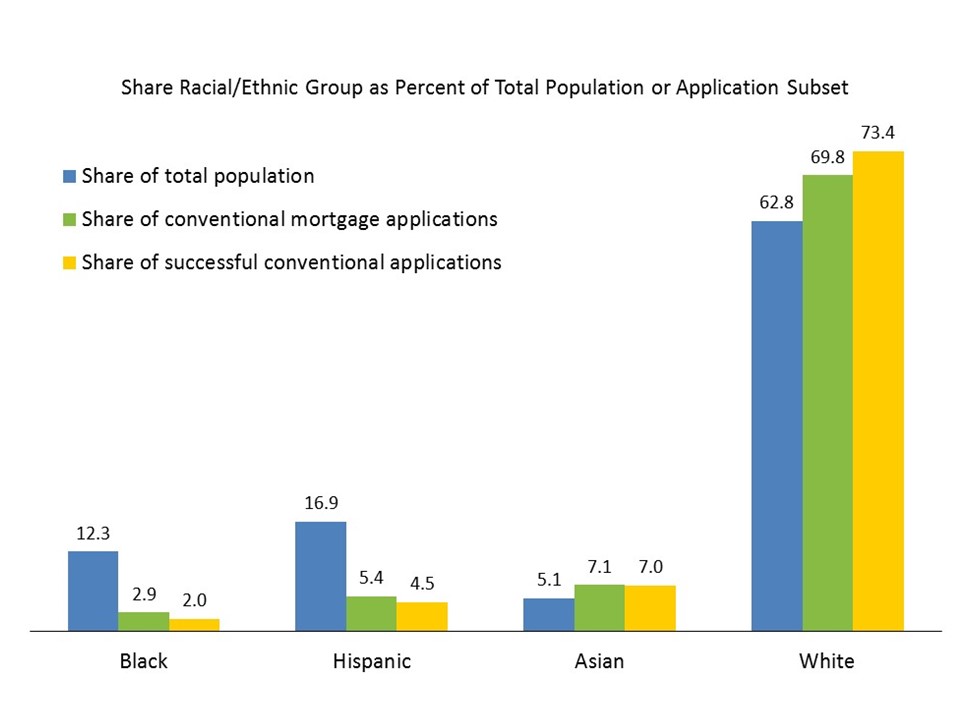
The racial and ethnic composition of FHA loans, which require lower down payments but typically carry higher interest rates, more closely reflects the composition of the United States as a whole. Among applicants for FHA home loans, 56.8 percent are white, 10.1 percent are black, 16.5 percent are Hispanic and 3.2 percent are Asian.
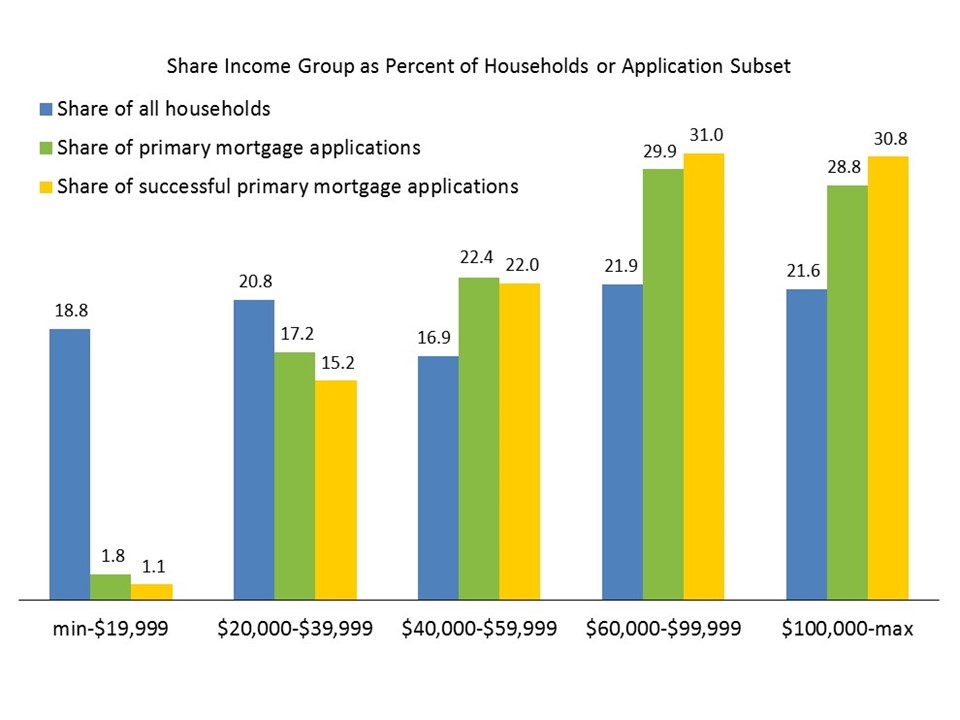
These results are driven, in part, by income discrepancies. While 18.8 percent of all U.S. households make less than $20,000—approximately the bottom fifth of all households with respect to income—only 1.8 percent of all applications for a home purchase loans report an annual household income below this level (see chart below). In the second income quintile, 20.8 percent of all households earn between $20,000 and $40,000, but 17.2 percent of all applications for a primary home purchase mortgage reported household income in this group. The difference between the income distribution for all households and applications for conventional mortgages is even sharper. Households making $100,000 or more compose only 21.6 percent of all households, yet make up 38.8 percent of all applications for a conventional mortgage.
 Of course, there is a strong correlation between income and race. African Americans are much more likely to report low household income: They are 20.2 percent of U.S. households making less than $20,000 per year but are 12.3 percent of the total population. The racial distribution of households in the second income quintile is somewhat more equitable, though racial and ethnic minorities are still underrepresented.
B. Loan quotes by income and credit history
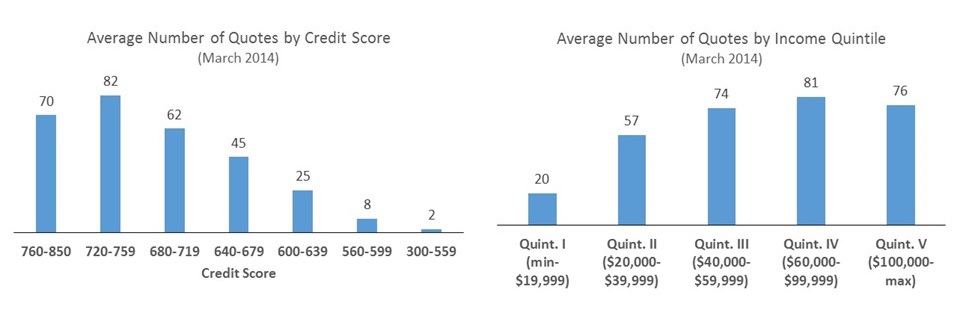
Using a unique Zillow database of loan requests and responses from lenders, we can estimate the average number of mortgage quotes that lenders offer to potential borrowers with different incomes and credit histories. To receive a quote on the Zillow Mortgage Marketplace (ZMM), a home shopper provides relevant information including household income and credit score. The data presented below show that more affluent borrowers have a much wider array of choices when shopping for a mortgage compared to less affluent borrowers.
Unsurprisingly, households with better credit histories and higher incomes received much greater attention from mortgage lenders. Borrowers with credit scores between 720 and 759 receive on average 82 mortgage quotes per loan request on ZMM as illustrated in the chart on the left below. (Borrowers with the highest credit scores likely receive slightly fewer quotes due to the large fraction seeking jumbo loans.) By contrast, borrowers with credit scores between 640 and 679—the lower bound of what are traditionally known as “prime” borrowers—receive about half as many quotes on average. Borrowers with credit scores between 600 and 639—the upper bound of what are traditionally known as “subprime” borrowers—receive on average 25 quotes per loan request. Historically, borrowers with credit scores below 600 rarely receive mortgage loans.
Similarly, borrowers with annual incomes between $60,000 and $99,999—roughly the top 60 percent to 80 percent of U.S. households—receive on average 81 quotes per loan request while borrowers in the lowest income quintile receive on average 20 quotes per loan request (see chart on the right below). The number of quotes drops off sharply between the first and second income quintiles. (Similar to the average number of quotes by credit score, the highest income borrowers likely receive fewer quotes on average compared to the quintile below due to the larger share of borrowers seeking jumbo loans.)
II. Profile of the Highly Leveraged
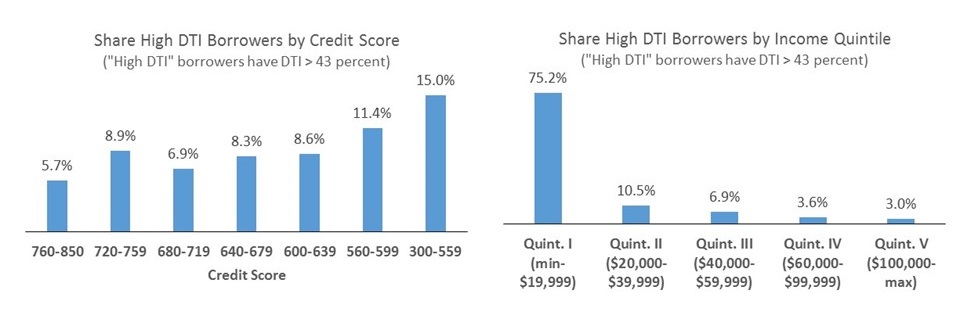
Using the ZMM data on loan requests and lender responses, we can estimate the average debt-to-income ratio (DTI) for several population subgroups. We then compare populations with high DTI ratios—defined as having a DTI greater than 43 percent (the threshold identified in proposed housing finance reform legislation)—to those who are relatively underserved in conventional mortgage markets.
A. Income and Credit
Borrowers with DTIs greater than 43 percent tend to have much lower incomes and poorer credit histories relative to borrowers in general.
As the figures below illustrate, just 5.7 percent of borrowers with pristine or near-pristine credit sought mortgages with a DTI greater than 43 percent compared to 15.0 percent of the highest risk borrowers. (Borrowers with credit scores below 640, the rightmost three bars in the chart on the left, are for the most part excluded from mortgage markets.) Similarly, only 3 percent of borrowers in the top fifth of household incomes sought mortgages with a DTI greater than 43 percent compared to more than 75 percent of borrowers in the bottom fifth of household incomes.
B. Race and ethnicity
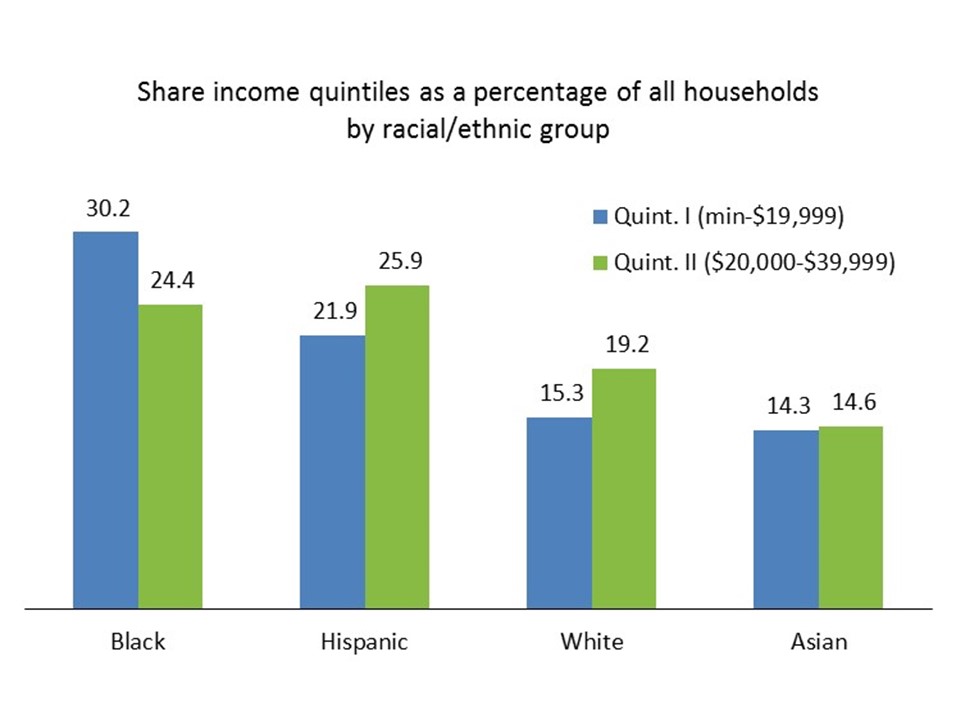
According to the 2012 American Community Survey, a larger share of African Americans and Hispanics fall within the bottom fifth of household incomes compared to other racial/ethnic groups. For example, 30.2 percent of African Americans and 21.9 percent of Hispanics have household incomes less than $20,000. By comparison, only 15.3 percent of whites and 14.3 percent of Asians fall in the bottom income quintile. This further emphasizes the close connection between race and income.
C. Geography
It is also likely that regions of the United States with high home values relative to income will be more affected than others by the proposed 43 percent threshold.
To estimate the average DTI within ZIP codes across the United States, we start with Zillow’s data on median home values for March 2014. Median income at the ZIP code level is drawn from U.S. Census Bureau data (pooled American Community Survey five-year sample for 2007-12). We then calculate the typical monthly mortgage payment in each ZIP code, assuming that a borrower has a 30-year fixed rate mortgage with a 20 percent down payment and a credit score between 640 and 679—the minimum typically allowed for a standard loan. The interest rate used to calculate the monthly payment is also drawn from Zillow data. Using mortgage quotes offered on Zillow during March 2014 from hundreds of U.S. banks to home shoppers across the country, we estimate the average interest rate offered to shoppers meeting the assumptions set for loan type and credit score—4.83 percent.
As the DTI ratio includes non-housing related debt, we also estimate the average minimum non-mortgage outstanding monthly debt. We use data from the Federal Reserve Bank of New York/Equifax Consumer Credit Panel on loan balances outstanding and the number of active accounts in 2013-Q4 (the most recent data available at the time of this writing). Assuming that minimum debt payments are equal to 2 percent of outstanding balances—as is common in the industry—we estimate the average minimum non-mortgage outstanding monthly debt to be $282: composed of $198 in automobile loans, $34 in credit card loans, and $50 in student loans.[4]
The DTI ratio is the sum of the monthly mortgage payment associated with the standard loan structure discussed above and the average of other monthly debts divided by median monthly income. This produces an estimate of average DTI across ZIP codes that varies only by home values and income—other factors potentially influencing DTI are held constant.
As the maps above illustrate, ZIP codes with high average DTI ratios tend to be concentrated along the West Coast, New England, and to a lesser extent, along the Gulf Coast. These are many of the same places with high African American/Hispanic populations, although the correlation is hardly perfect.
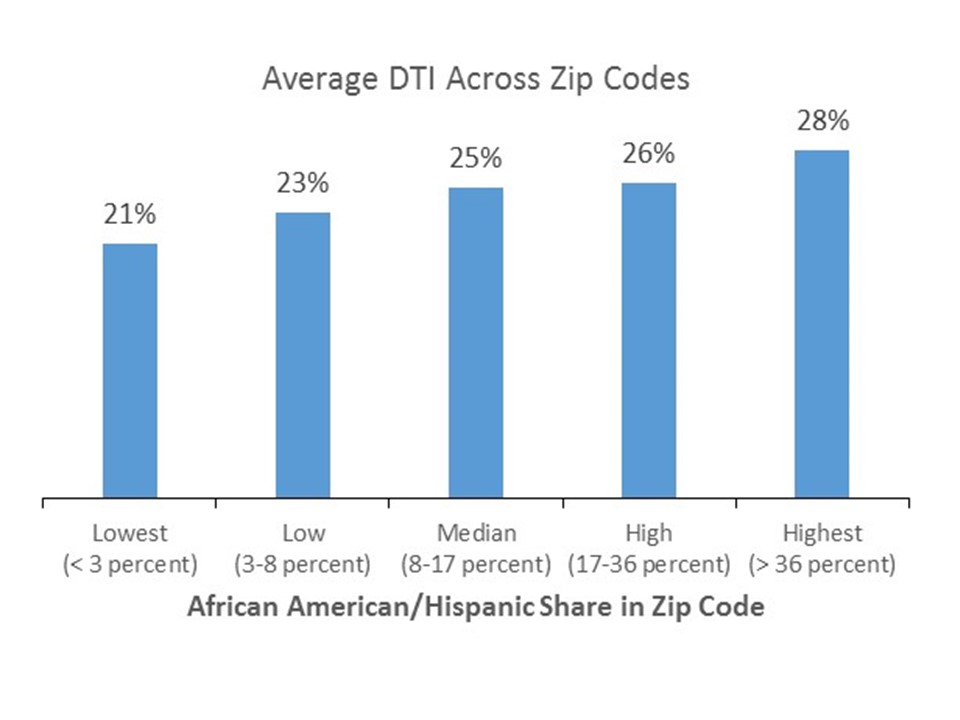
When we compare the ethnic and racial composition of ZIP codes, and the debt burden of mortgages that are sought in those ZIP codes, we find that average DTIs tend to be higher in ZIP codes with high concentrations of African Americans and Hispanics. As illustrated in the chart below, the average DTI in ZIP codes with very few African Americans or Hispanics (less than 3 percent of the population) was 21 percent, compared to an average DTI of 28 percent in zip codes where African Americans and Hispanics account for 36 percent or more of the population.
Income, credit history, and race/ethnicity tend to be highly correlated, so we cannot conclude which features are the primary drivers of lending outcomes. However, the data presented above suggests that the 43 percent DTI standard will disproportionately affect households with poor credit histories, low-income households, and African-Americans and Hispanics through their greater likelihood of having low incomes.
[1] HMDA requires most U.S. financial institutions to annually report data about residential mortgage lending applications and outcomes to the Federal Financial Institutions Examination Council (FFIEC), an interagency body that includes the Federal Reserve Board of Governors, the Federal Deposit Insurance Corporation, the National Credit Union Administration, the Office of the Comptroller of Currency and the Consumer Financial Protection Bureau.
[2] This analysis originally appeared in the Zillow report “A House Divided – How Race Colors the Path to Homeownership” published in January 2014.
[3] Conventional mortgages meet lending criteria set by Freddie Mac or Fannie Mae.
[4] For more information on the Federal Reserve Bank of New York/Equifax Consumer Credit Panel, see http://www.newyorkfed.org/microeconomics/ccp.html. The FRBNY data do not contain counts of student loan accounts, as a result, we estimate average minimum monthly student loan payments of $50, an industry standard as reported by Sallie Mae at http://go.salliemae.com/content/edServicing/federalLoans/in-repayment/.
