Renters: Results from the Zillow Consumer Housing Trends Report 2023

High mortgage interest rates, high home values, and high rents continued to fuel affordability challenges for buyers and renters. Renters also face one of the lowest rental vacancy rates in recent history – at only 5.8% [1] – limiting options, mobility, and placing upward pressure on rents. While these trends reshape the homebuying process and renters’ plans and preferences, many renters’ behaviors, intentions, and preferences have remained relatively stable over the years. Amid the flurry of challenges, much of the rental market remains following the pandemic-catalyzed new ‘normal.’
The 2023 Consumer Housing Trends Report (CHTR) provides a snapshot of what housing consumers are thinking and doing in early-to-mid 2023. In this report, we take a deeper look at renters, who represent about 1 in 3 adults in the United States (30%). [2] CHTR includes both renters who have moved in the last year (“recent renters,” who have been the historical focus of the report), as well as tenured renters who have lived in their homes longer. In other CHTR 2023 reports, we examine the general US population, buyers, and sellers more closely. Information about who renters are in 2023 equips consumers with the information they need to make informed decisions in the ever-evolving housing market.
The typical [3] US renter is 39 years old. Compared with the adult population as a whole, the renter population tends to be younger, more racially diverse, less likely to have ever been married, and more to identify as LGBTQ+. Most of these trends are especially true for recent renters. Demographic change tends to play out over a long time: Most of these characteristics have not changed substantially, if at all, over the last few years.
As we will detail throughout the report, there are several notable differences by renter tenure. For example, for renters who moved in the last year (recent renters), the median age is 30 years old. Renters who have lived in their current home for at least a year are typically older: their median age is 41 years old.
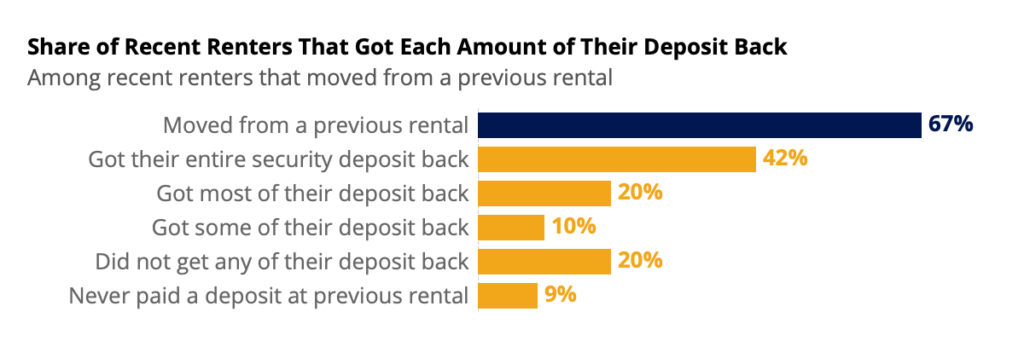
Most renters (53%) live in an apartment building. The typical rental home has 2 bedrooms and 1.5 bathrooms, and is 1000 – 1999 square feet. [4] About two-thirds of recent renters (67%) moved from a previous rental.
The typical (median) recent renter submitted 2 applications. For renters who paid an application fee (84%), the typical amount was $50 to secure their current rental and $80 across all properties they applied for. Most recent renters (87%) also reported paying a security deposit — typically $500 to $999. Many of these renters will forfeit at least part of their deposit. About 91% of those who moved from a previous rental reported paying a security deposit there, but only 42% say they got it returned in its entirety. Renters in urban and suburban areas, renters of color, younger renters, and renters in regions with the most expensive rental markets are all more likely to pay an application fee and those fees tend to be higher.
From a series of home characteristics, renters are most likely to say that a home that’s within their initial budget is very or extremely important (83%), followed by having their preferred number of bedrooms (69%). After years of falling or stagnant importance of common amenities like gyms and recreation space, 2023 saw the importance of these common amenities rebound – some to record levels. Despite this shift, however, the high importance of staying on budget still outpaces shared amenities.
About three in five renters (61%) say they are considering moving within the next three years. For recent renters, the share is even larger: 72% say they plan to move again in the next three years. Despite the unprecedented events of the pandemic and housing market, this number has remained relatively flat from 2018 (68%), 2019 (67%), 2020 (69%), 2021 (70%), and 2022 (73%). Among renters considering moving, about half (52%) say they plan to continue renting while 43% say they plan to buy their next home. The remainder (4%) say they plan to have another living situation.
In order to gain a comprehensive understanding of U.S. renters, Zillow Group Population Science conducted five nationally representative surveys of this population – each sampling with at least 3,000 renter-respondents. In total, the five surveys contain information from over 21,000 unique renters – more than 5,600 recent renters and 15,600 tenured renters. Participants were allowed to take more than one survey. The study was fielded between April and July 2023.
Wherever possible, survey questions from previous years were asked in the same manner this year to allow for the measurement of year-to-year trends in key areas of interest.
For the purpose of this study, “renters” refers to household decision makers 18 years of age or older who rent their primary residence. “Recent renters” refer to those that moved in the past year, and “tenured renters” refer to those that did not move in the past year.
Results from this survey are nationally representative of renters. To achieve representativeness, ZG Population Science used a two-prong approach. First, the initial recruitment to the sample was balanced to all renters from the U.S. Census Bureau, 2021 American Community Survey (ACS) on the basis of age, relationship status, income, ethnicity/race, education, region and sex. The survey targeted subgroups based on all key household demographic characteristics. Second, statistical raking was used to create calibration weights to ensure that the distribution of survey respondents matched the U.S. population with respect to a number of key demographic characteristics. Weighting benchmarks used the 2021 ACS for race and income and the 2022 Current Population Survey Annual Social and Economic Supplement (CPS ASEC) for geographic division/region, education, age and sex.
To reduce response bias, survey respondents did not know that Zillow Group was conducting the survey. Several additional quality control measures were also taken to ensure data accuracy:
Unless otherwise specified, estimates in this report come from the Consumer Housing Trends Report (CHTR) 2022, and year-over-year comparisons also use data from CHTR 2018, CHTR 2019 CHTR 2020, CHTR 2021, CHTR 2022, and supplemental renter surveys. To provide a fuller picture of the state of home rentals and renters’ characteristics, preferences and behaviors, we also analyzed data from other sources:
In this section, we provide a high-level overview of key renter info and what their homes look like. According to Census Bureau 2021 American Community Survey, 30% of adults in the country are renters (regardless of whether they moved in the past year). About a fifth (22%) of these renters moved in the past year.
The median age of U.S. renters is 39 years old and about half (51%) of renters are under the age of 40; only 9% of renters are in their seventies or older, and 10% are in their sixties. In other words, the age distribution of renters trends younger than the overall U.S. population. While past research has referred to renters who moved in the past year, renters as a whole, including tenured renters who did not move, skew older. The median age for a tenured renter (who did not move in the past year) is 41 — about a decade older than the typical renter that moved (30).
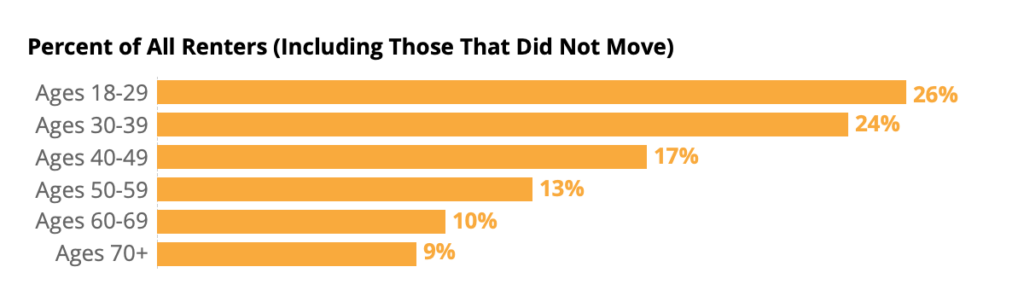
| Age Group | Percent of Recent Renters | Percent of All Renters (including those that did not move) | Percent of Household Decision Makers | Percent of US Adults |
| Ages 18-29 | 47% | 26% | 15% | 20% |
| Ages 30-39 | 23% | 24% | 18% | 18% |
| Ages 40-49 | 13% | 17% | 16% | 16% |
| Ages 50-59 | 9% | 13% | 17% | 16% |
| Ages 60-69 | 5% | 10% | 17% | 16% |
| Ages 70+ | 4% | 9% | 17% | 15% |
Source: Census Bureau, 2022 Current Population Survey Annual Social and Economic Supplement
Consistent with age, the largest generational group of renters is between 29 and 43 years old in 2023 — the group colloquially known as “Millennials.” About 35% of renters are Millennials.
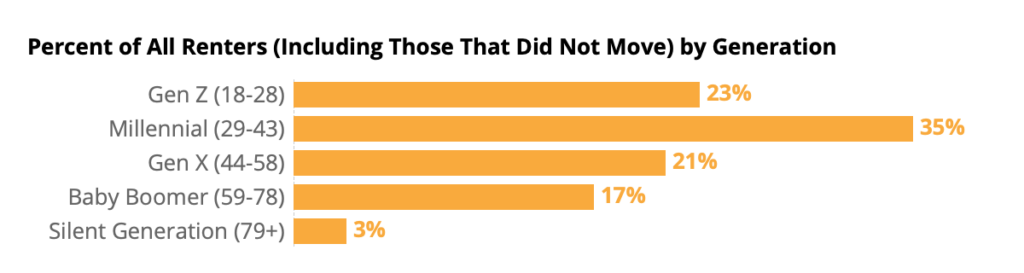
| Generation | Percent of Recent Renters | Percent of All Renters (including those that did not move) | Percent of Household Decision Makers | Percent of US Adults |
| Gen Z (18-28) | 43% | 23% | 13% | 18% |
| Millennial (29-43) | 33% | 35% | 27% | 26% |
| Gen X (44-58) | 14% | 21% | 24% | 24% |
| Baby Boomer (59-78) | 8% | 17% | 30% | 27% |
| Silent Generation (79+) | 2% | 3% | 7% | 5% |
Source: Census Bureau, 2022 Current Population Survey Annual Social and Economic Supplement
About half of renters are non-Hispanic white or Caucasian (50%), smaller than the share of the overall U.S. adult population that is white (61%). At the same time, 12% of U.S. adults identify as non-Hispanic Black or African American, while 18% of renters are Black.
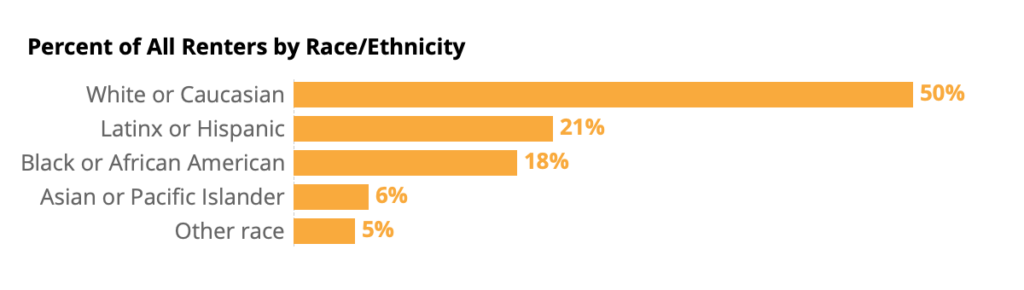
| Race/Ethnicity | Percent of Recent Renters | Percent of All Renters | Percent of Household Decision Makers | Percent of US Adults |
| White or Caucasian | 55% | 50% | 64% | 61% |
| Black or African American | 15% | 18% | 12% | 12% |
| Latinx or Hispanic | 17% | 21% | 15% | 17% |
| Asian or Pacific Islander | 7% | 6% | 5% | 6% |
| Other race | 6% | 5% | 4% | 5% |
Source: Census Bureau, 2021 American Community Survey
The largest share of renters live in the South (36%), followed by the West (28%), Northeast (19%) and Midwest (18%).
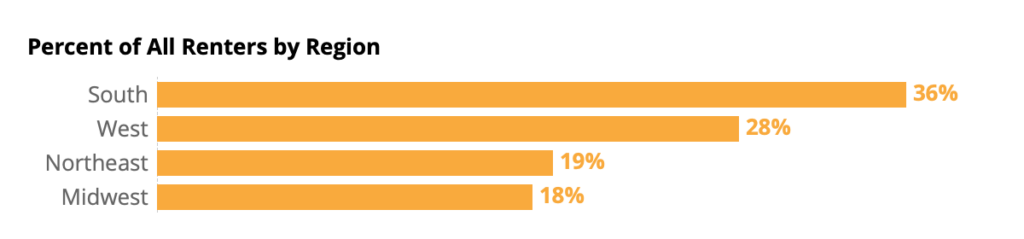
| Region | Percent of Recent Renters | Percent of All Renters | Percent of Household Decision Makers | Percent of US Adults |
| South | 40% | 36% | 38% | 38% |
| West | 29% | 28% | 23% | 24% |
| Midwest | 19% | 18% | 21% | 21% |
| Northeast | 11% | 19% | 17% | 17% |
Source: Census Bureau, 2022 Current Population Survey Annual Social and Economic Supplement
The share of the population that rents also varies regionally. About a quarter of household decision makers in the Midwest (24%) are renters, while about 39% in the Northeast are.
Moreover, nearly twice as many renters in the South, West, and Midwest are recent renters compared with the Northeast.
| Region | Percent of Adults that Rent | Percent of Household Decision Makers that Rent | Percent of Renters that Recently Moved |
| South | 28% | 28% | 20% |
| West | 36% | 37% | 19% |
| Midwest | 24% | 25% | 20% |
| Northeast | 39% | 33% | 11% |
Source: Census Bureau, 2022 Current Population Survey Annual Social and Economic Supplement

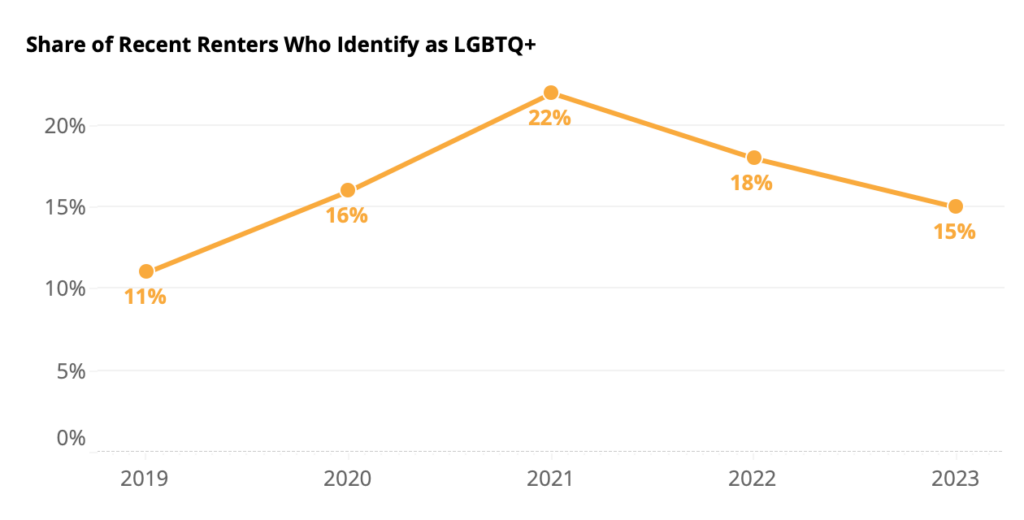
In 2023, about 15% of renters identified as LGBTQ+. [6] Over time this number has waxed and waned. About one in ten (11%) recent renters identified as LGBTQ+ in 2019, the first year CHTR asked about sexual orientation and gender identity, then 16% in 2020. The share that identified as LGBTQ+ peaked in 2021 at 22%. In 2022, 18% of recent renters identified as LGBTQ+. Recent renters in 2023 are more likely to identify as LGBTQ+ (20%) than tenured renters (13%) or renters as a whole (15%). Younger renters are more likely to self-identify as LGBTQ+: The median age of an LGBTQ+ renter is 31 – versus 41 for cisgender heterosexual renters. Renters trending younger than the US adult population as a whole may help explain why renters are also more likely to identify as LGBTQ+.
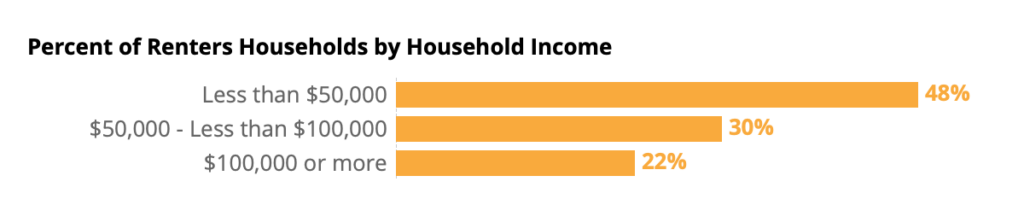
Renters tend to have lower incomes than the U.S. population overall. The annual median household income among renter households is approximately $47,301, compared to the overall national median of $70,784. [7]
| Household Income | Percent of Recent Renter Households | Percent of Renter Households | Percent of All Households |
| Less than $50,000 | 48% | 52% | 36% |
| $50,000 – Less than $100,000 | 29% | 28% | 28% |
| $100,000 or more | 23% | 20% | 36% |
Source: Census Bureau, 2022 Current Population Survey Annual Social and Economic Supplement
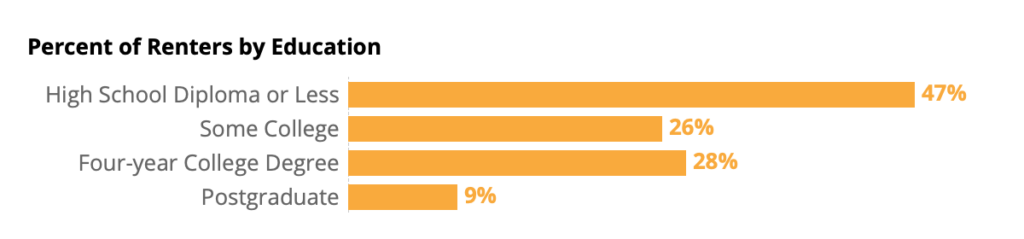
Renters as a whole tend to have a lower level of education to the overall population of U.S. adults: Only 30% of renters have at least a four-year degree, lower than 35% of overall U.S. adults. Recent renters, however, are slightly more likely to have at least a four-year degree (37%).
| Education | Percent of Recent Renters | Percent of Renters | Percent of Household Decision Makers | Percent of US Adults |
| High School Diploma or Less | 35% | 43% | 35% | 39% |
| Some College | 28% | 27% | 27% | 26% |
| Four-year College Degree | 25% | 20% | 24% | 22% |
| Postgraduate | 12% | 10% | 14% | 13% |
Source: Census Bureau, 2022 Current Population Survey Annual Social and Economic Supplement
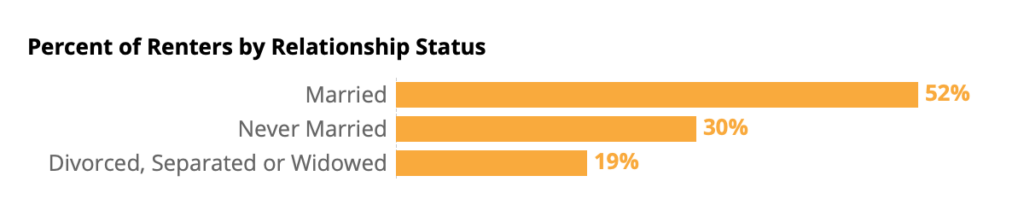
Skewing younger than the U.S. population as a whole, renters are less likely to be married. About a third (30%) are single and never married, versus 25% of adults overall. This difference in relationship status may provide a partial explanation for the lower household income of renters compared with the overall population.
| Relationship Status | Percent of Recent Renters | Percent of Renters | Percent of Household Decision Makers | Percent of US Adults |
| Never Married | 35% | 30% | 20% | 25% |
| Married | 53% | 52% | 57% | 60% |
| Divorced, Separated or Widowed | 12% | 19% | 22% | 16% |
Source: Census Bureau, 2022 Current Population Survey Annual Social and Economic Supplement
Renter households are more likely to report having at least one pet (59%) than a child (33%). Compared to the population as a whole, renter households are slightly less likely to have a child (33% of renter households, versus 36% of households overall).
| In Household | Recent Renter Households | Tenured Renter Households | All Renter Households | All Households [8] | |
| Children under 18 [9] | 29% | 34% | 33% | 36% | |
| Dog | 40% | 40% | 40% | 38% | |
| Cat | 29% | 33% | 32% | 22% | |
| Another pet | 11% | 12% | 11% | 10% | |
| NET: Any pet | 57% | 60% | 59% | 50% | |
Apartments of various sizes are what most renters call home: 53% of renters report living in an apartment building. About one in five renters (18%) say they rent in a smaller-size apartment or condo building (fewer than 10 units). A similar 17% said they live in a medium-size building (10-49 units), and 17% said they live in a larger multifamily building (50 units or more). About 29% live in a single-family detached house.
| Home Type | Share of Renters |
| Apartment in a smaller size building (fewer than 10 units) | 18% |
| Apartment in a medium size building (10-49 units) | 17% |
| Apartment in a larger size building (50 units or more) | 17% |
| Single-family detached house | 29% |
| Townhouse / rowhouse | 7% |
| Duplex / triplex | 6% |
| Manufactured / mobile home | 3% |
| Room in shared housing | 2% |
| Boat, RV, van, etc. | <1% |
The typical (median) renter lives in a 2-bed, 1.5-bath apartment between 1,000 and 1,999 square feet.
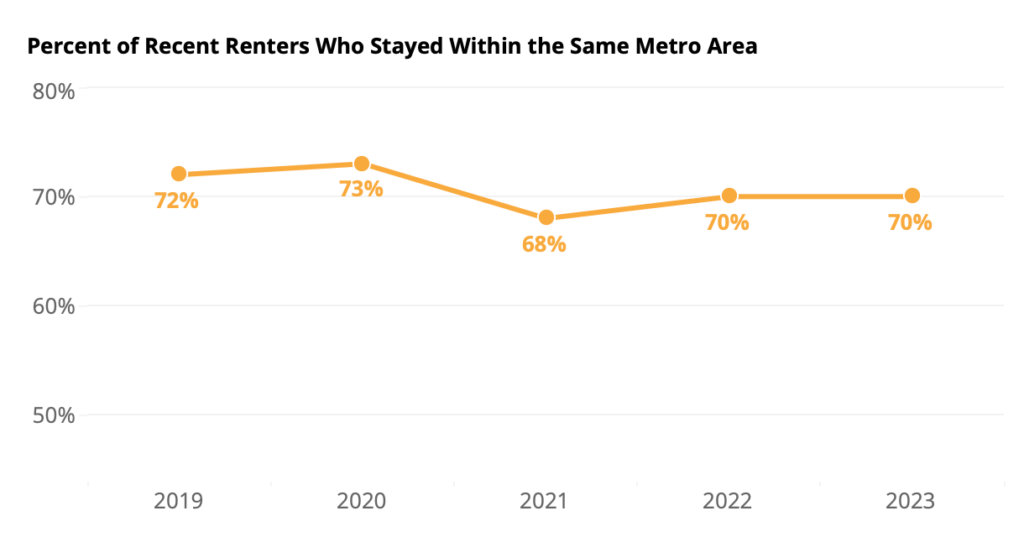
When asked how far they moved, the largest share of recent renters said they stayed in the same city, but changed neighborhoods (40%). About one in ten (12%) reported staying in the same neighborhood. The smallest share (2%) moved from abroad.
| Distance Moved | 2019 | 2020 | 2021 | 2022 | 2023 |
| Same neighborhood | 16% | 14% | 11% | 11% | 12% |
| Same city, different neighborhood | 38% | 40% | 39% | 40% | 40% |
| Same metro, different city | 19% | 19% | 19% | 19% | 19% |
| Same state, different metro | 13% | 12% | 16% | 15% | 15% |
| Same country, different state | 13% | 13% | 13% | 13% | 13% |
| Moved from abroad | 2% | 2% | 2% | 3% | 2% |
That is, about 70% of recent renters stayed within the same metro area. Over time, this number has largely stayed stable (72% in 2019, 73% in 2020, 68% in 2021, 70% in 2022).
 The typical (median) recent renter submitted two applications — one online and one on paper/in person. For these rental applicants, the typical application fee to apply for their current rental was $50 and the typical recent renter reported paying $60 in total across all the rentals they applied for.
Paying a rental application fee was the norm across generations. However, younger renters were more likely to submit at least one application than their older counterparts. While most Gen Z (89%) and Millennial (86%) recent renters paid at least one application fee, smaller – albeit still high – shares of Gen X (73%) and Boomer & Silent Generation (73%) recent renters paid one.
| Age Group | Share that Paid An Application Fee | Share that Paid An Application Fee of At Least $40 |
| Ages 18-29 | 90% | 69% |
| Ages 30-39 | 85% | 61% |
| Ages 40-49 | 78% | 54% |
| Ages 50-59 | 73% | 54% |
| Ages 60+ | 72% | 50% |
| Generation | Share that Paid an Application Fee | Share that Paid An Application Fee of At Least $40 |
| Gen Z (Ages 18-28) | 89% | 69% |
| Millennial (Ages 29-43) | 86% | 61% |
| Gen X (Ages 44-58) | 73% | 55% |
| Baby Boomers & Silent Generation (Ages 59+) | 73% | 51% |
While the typical amount that recent renters report paying is the same as previous years (still a median of $50), a significantly larger share of recent renters report paying an application fee (84% in 2023, up from 68% in 2022). This higher prevalence of application fees suggest that, following the boom in rental demand from spring of 2021, landlords and property managers may have been able to increasingly forgo waiving upfront fees, and pass administrative costs like credit and background checks onto rental applicants.
Across racial groups, paying an application fee is more common than not, but renters of color are more likely to report paying one: Larger shares of Black (89%) and Latinx (88%) recent renters reported paying an application fee than white renters (82%). Latinx renters were also about twice as likely as their non-hispanic white counterparts to report submitting 5 applications or more (27% Latinx recent renters reported submitting 5 or more, compared to 13% of white renters).
Recent renters of color also reported paying higher total amounts in application fees: The typical white renter reported paying $50 in application fees across all the rentals they applied for, while the typical Black ($70), Latinx ($100), and Asian ($95) recent renters all reported spending more. [10]
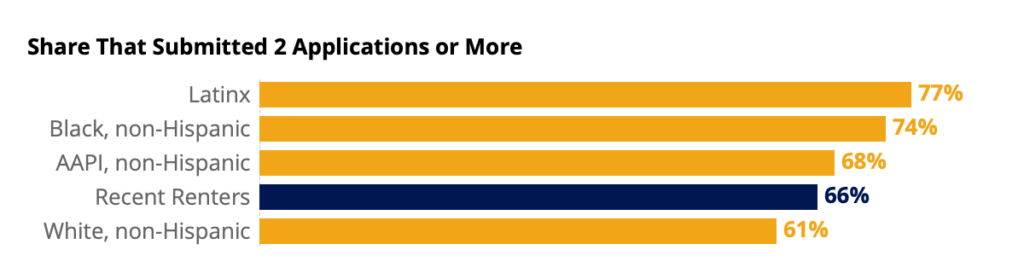
| Race/ Ethnicity | Share that Paid an Application Fee | Share that Paid At Least $40 | Share that Submitted 2 Applications or more |
| Recent renters | 84% | 63% | 66% |
| White, non-Hispanic | 82% | 60% | 61% |
| Black, non-Hispanic | 89% | 66% | 74% |
| Latinx | 88% | 73% | 77% |
| AAPI, non-Hispanic | 86% | 61% | 68% |
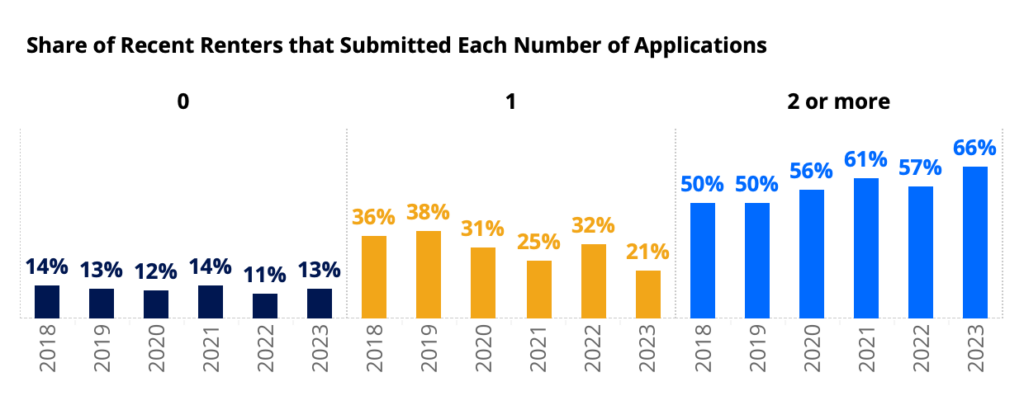
| Share of Recent Renters that Submitted Each Number of Applications | 2018 | 2019 | 2020 | 2021 | 2022 | 2023 |
| 0 | 14% | 13% | 12% | 14% | 11% | 13% |
| 1 | 36% | 38% | 31% | 25% | 32% | 21% |
| 2 or more | 50% | 50% | 56% | 61% | 57% | 66% |
Renters in large multifamily buildings (those with 50 units or more) were most likely to report submitting at least one application: 96% do, compared with 81% of those in single-family detached houses and 89% of those renting other home types.
| Type of Home Rented | Share that Submitted At Least 1 Application | Share that Paid an Application Fee | Median Application Fee | Median Application Fee Among Renters Who Paid One |
| Recent renters | 87% | 84% | $50 | $50 |
| Multifamily (50+ units) | 97% | 95% | $50 | $50 |
| Single-family detached | 72% | 70% | $35 | $50 |
| Other | 90% | 87% | $50 | $50 |
For renters that pay one, the typical security deposit reported in 2023 was between $500 and $999.
The oldest generations of renters are the most likely to avoid paying a deposit at all: 76% report paying a security deposit — lower than 90% of Gen Z, 90% of Millennial, and 81% of Gen X renters.
| Generation | Share that Paid a Security Deposit |
| Recent renters | 87% |
| Gen Z (Ages 18-28) | 90% |
| Millennial (Ages 29-43) | 90% |
| Gen X (Ages 44-58) | 81% |
| Baby Boomers & Silent Generation (Ages 59+) | 76% |
| Age Group | Share that Paid a Security Deposit |
| Recent renters | 87% |
| Ages 18-29 | 90% |
| Ages 30-39 | 89% |
| Ages 40-49 | 85% |
| Ages 50-59 | 77% |
| Ages 60+ | 76% |
Renters of color are more likely to report paying a security deposit: 86% do, compared to 84% of white renters. Latinx and Asian American/Pacific Islander renters are more likely to pay a more expensive deposit: 39% of Latinx and 43% of AAPI renters paid at least $500 for their deposit, and 22% of Latinx and 30% of AAPI renters paid at least $1,000.
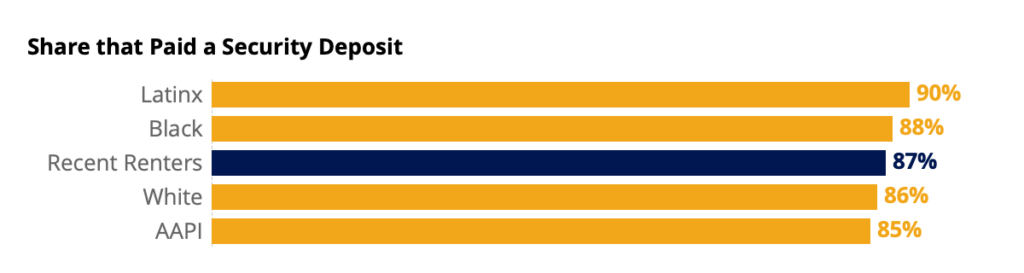
| Race/ Ethnicity | Share that Paid a Security Deposit | Deposit of At Least $500 | Deposit of At Least $1,000 |
| Recent renters | 87% | 38% | 22% |
| White | 86% | 35% | 20% |
| Black | 88% | 48% | 20% |
| Latinx | 90% | 40% | 29% |
| AAPI | 85% | 37% | 27% |
Regardless of the type of home rented, paying a deposit is the norm: 87% of recent renters reported paying one. Recent renters in single-family detached houses, though, can be slightly more likely to dodge paying a deposit: 21% of single-family recent renters reported paying no security deposit – higher than 8% of multifamily renters and 12% of renters in other home types. When they don’t avoid paying one, single-family deposit amounts are typically higher: The typical security deposit among single-family renters who pay one was $1,000 – $1,499 – higher than the median of $500 – $999 for renters in multifamily and other types of buildings. A lower likelihood of paying an application fee (which often includes a credit check) combined with the fact that single-family renters are more likely to rent from a private owner (who may be less able to offset risk from a single tenant than a professional management company) likely contribute to this difference.
| Type of Home Rented | Share that Paid a Security Deposit | Median Security Deposit | Median Security Deposit Among Renters Who Paid One | Share that Paid At Least $500 | Share that Paid At Least $1,000 |
| Recent renters | 87% | $500 – $999 | $500 – $999 | 40% | 22% |
| Multifamily (50+ units) | 92% | $500 – $999 | $500 – $999 | 36% | 17% |
| Single-family detached | 79% | $500 – $999 | $1,000 – $1,499 | 49% | 31% |
| Other | 88% | $500 – $999 | $500 – $999 | 38% | 20% |
| Type of Home Rented | Share that rent from a private owner (rather than a professional management company) | Share that knew their landlord/property manager personally |
| Recent renters | 43% | 23% |
| Multifamily (50+ units) | 17% | 8% |
| Single-family detached | 67% | 38% |
| Other | 49% | 21% |
Among the 67% of recent renters that moved from a previous rental, about two in every five (42%) reported getting their entire deposit back. One in five (20%) say they got most of it back, 10% say they got some of it, and another fifth (20%) say they did not get any of their deposit back. The remaining tenth (9%) say they never paid a deposit at their previous rental. White renters were more likely to say that they never paid a deposit at their previous rental (10% of white renters versus 7% of renters of color).
About half (52%) of recent renters who moved from a previous rental say they disagreed with their landlord or property manager about something. About a quarter (27%) said they disagreed about repair, damage or maintenance on the property and a fifth (22%) disagreed about the responsibility for utility payments like electricity, heat, gas, or internet. Another fifth (19%) said they disagreed about move-out costs or fees.
When asked what encouraged them to stay at their current rentals, tenured renters were most likely to say that their rental costs were a good deal (72%), followed by not being able to afford to move somewhere else (66%). Smaller shares cited liking their landlord or property manager (60%), a floor plan or layout that fit their preferences (61%), and private outdoor space (50%). Tenured renters were least likely to cite their rental’s common amenities like a gym or conference room (33%) as encouragement for staying put.
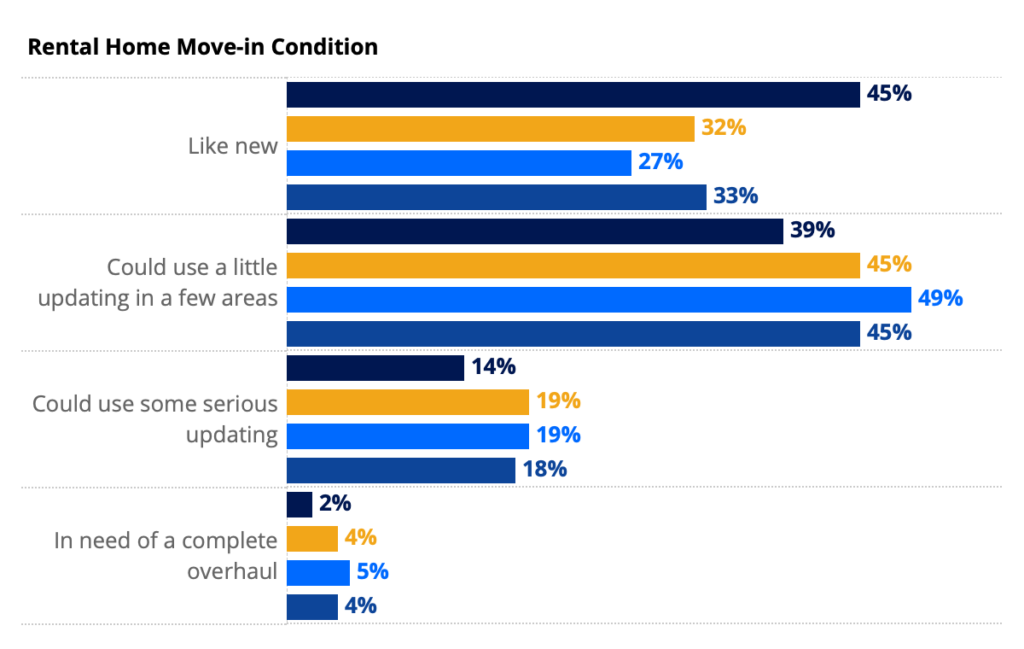
Only a third of renters (33%) say their home was “like new” when they moved in. The largest share (45%) said their home could use a little updating in a few areas. About another fifth (18%) said it could use some serious updating. And a small 4% said their rental was in need of a complete overhaul.
Renters in multifamily buildings (with 50 units or more) were most likely to say that their rental’s move-in condition was “like new” (45%) – higher than 27% of single-family detached home renters and 32% of renters in other types of homes (like townhouses and small/medium apartments).
About four in five renters (79%) say they documented their home’s move-in condition in at least one way. The most common was taking photos and/or videos of the move-in condition (40%). A third (37%) filled out a property condition checklist or report. About a quarter (27%) told their property manager in person or over the phone.
Of the renters who told their property manager orally, about two in five (42%) also completed another step like taking photos, videos, and/or filling out a checklist or report.
Among those that filled out a move-in inspection checklist or report, 31% completed it with only their landlord. About half (47%) completed it with only their property manager, and 6% completed it with both their landlord and property manager. Almost a fifth (17%) completed the checklist on their own – without their landlord nor their property manager.
The majority of renters that moved from another rental said they left their rental in the same condition as they arrived (61%). About a fifth say they left it in worse condition (20%) and another fifth say they left it better than they found it (19%).
About two thirds of tenured renters (66%) say their rental includes some kind of common amenity – the most common being a private fenced yard or garden (30%). Almost a quarter (23%) say they have a gym or fitness center (23%). A fifth (20%) say they have a private yard or garden that isn’t fenced. The least common amenities include a conference room or business center (12%), a rooftop deck (9%), and a pet washing station (6%).
Tenured renters with dogs are more likely to report having a private fenced yard: Two in five (40%) of tenured renters with at least one dog in the home say their rental includes one, versus 23% of tenured renters without dogs.
Recent renters surveyed in 2023 were more likely to consider each neighborhood characteristic we asked about as very or extremely important. The largest gain was for proximity to shopping, services and/or leisure activities – from 49% in 2022 to 56% in 2023. Proximity to public transit and neighborhood walkability also saw increases.
| Share of Recent Renters who Consider each Neighborhood Characteristic Very or Extremely Important | 2018 | 2019 | 2020 | 2021 | 2022 | 2023 |
| Close to family and/or friends | 36% | 37% | 38% | 39% | 37% | 39% |
| Close to shopping, services, and/or leisure activities | 47% | 50% | 51% | 49% | 49% | 56% |
| Close to public transportation | 36% | 35% | 34% | 31% | 33% | 37% |
| My commute to work or school | 58% | 57% | 55% | 52% | 56% | 59% |
| In a walkable neighborhood | 55% | 56% | 55% | 56% | 57% | 61% |
| Offered a sense of community or belonging | 33% | 34% | 34% | 35% | 39% | 42% |
A near-unanimous share of renters (94%) said they consider staying within their initial budget as “essential” – higher than any other characteristic we asked about. Having their preferred number of bedrooms (84%), bathrooms (69%), and floor plan or layout (70%) all trailed. A large majority of renters also said that broadband internet was essential (80%), while closer to half (54%) said they considered gigabit internet the same. A smaller share (43%) said that having 2 or more internet providers to choose from was essential. And 45% said the same about the home being newly built or recently renovated.
About four in five renters (82%) say that housing prices are too high compared to fair value – higher than about three in five (59%) of homeowners. Only one in six renters (17%) say that housing prices are just right. The remaining 2% said that housing prices are too low.
Almost half (45%) of renters say that they would be very or extremely likely to buy a home if rates fell, versus only one in five (20%) who say the same if rates rise. If rates continue to rise, according to renters, then most say they are not very or not at all likely to buy their next home (59%), compared to only 29% who say the same if rates fell.
The share of recent renters who say they searched on a mobile website held onto its increase from 2021: (74% in 2023, 2022, and 2021, up from 65% in 2020) and/or on a mobile app (63% in 2023, 60% in 2022 and 2021, up from 51% in 2020). [12]
| Online resources recent renters used when searching | 2019 | 2020 | 2021 | 2022 | 2023 |
| Website on a laptop / desktop computer | 70% | 72% | 73% | 67% | 68% |
| Mobile website on a smartphone / tablet | 64% | 65% | 74% | 74% | 74% |
| App on a smartphone / tablet | 46% | 51% | 60% | 60% | 63% |
Despite falling in 2022, the share of online-searching recent renters that used 10 or more sites/apps in their rental search rebounded in 2023, from 16% in 2022 to 22% in 2023 – still not reaching its 2020 peak (26%).
| Number of sites/apps recent renters used when searching | 2019 | 2020 | 2021 | 2022 | 2023 |
| 0 sites/apps | 16% | 13% | 11% | 10% | 9% |
| 1-4 sites/apps | 26% | 25% | 28% | 39% | 35% |
| 5-9 sites/apps | 34% | 36% | 37% | 34% | 34% |
| 10+ | 24% | 26% | 23% | 16% | 22% |
| Median number of sites/apps used | 5 | 6 | 6 | 5 | 5 |
When asked what home characteristics they are most likely to consider very or extremely important, renters have consistently said that staying within their initial budget is highly important. The largest majority (83%) said so, higher than any other home characteristic.
Preferred number of bedrooms was the runner-up, at a distant 69%. Preferred number of bathrooms (55%) and floor plan/layout (51%) followed.
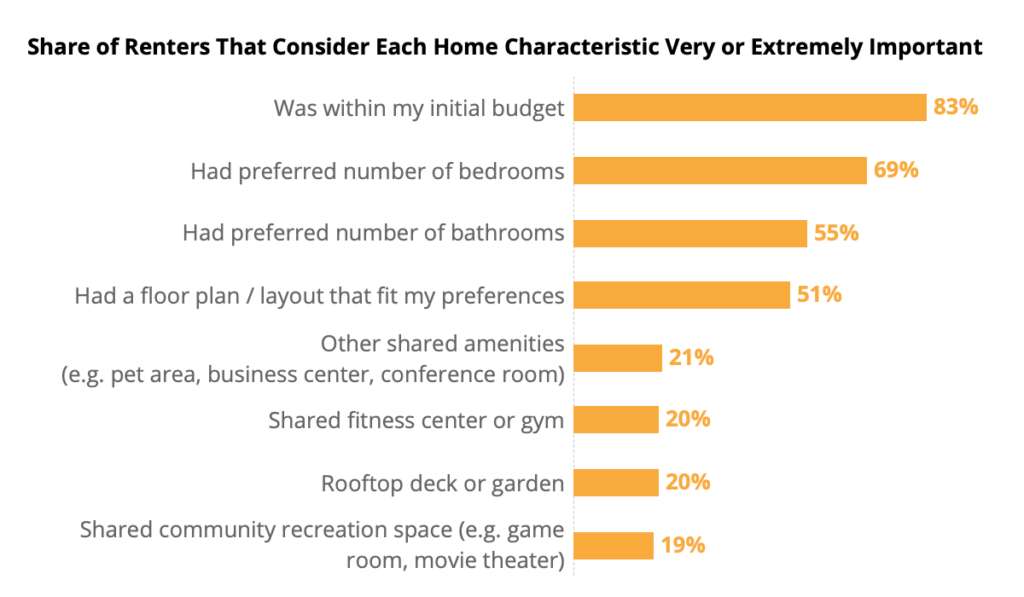
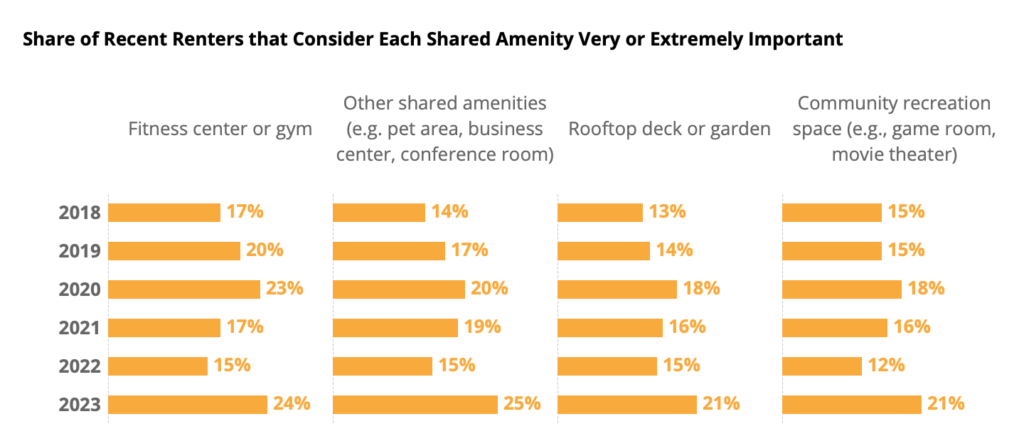
After 2 years of decline and stagnation, these common amenities finally see their post-pandemic rebound: About a quarter of recent renters (24%) said a fitness center or gym was highly important – a 9-point increase from last year. One in five said the same about a community recreation space (21%) and a rooftop deck or garden (21%) – record highs for both amenities. A quarter (25%) also said other shared amenities like a pet area, business center, or conference room were highly important – the highest share ever reported.
Between 2018 and 2020, the share of recent renters who considered various shared community amenities like gyms, decks, gardens, and game rooms highly important inched upward. In 2021’s survey, however, this trend appears to have ground to a halt or even reversed. And in 2022, despite many of these amenities reopening, recent renters were similarly or less likely to consider each highly important.
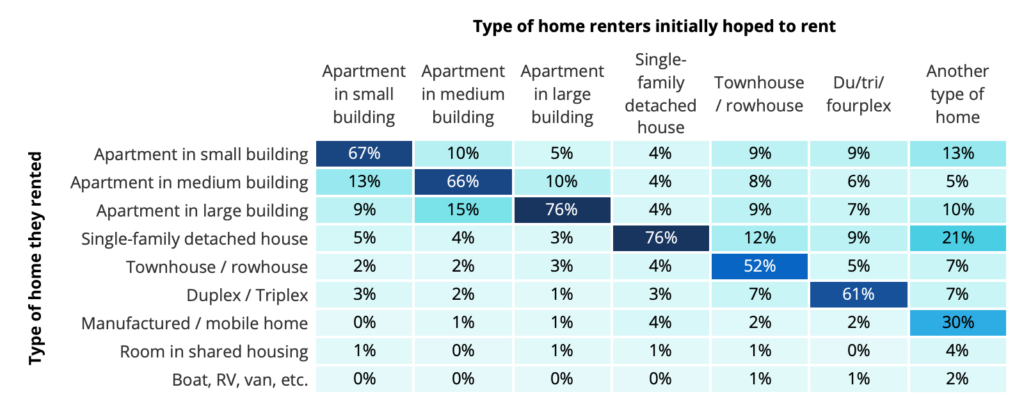
Most renters (54%) included an apartment among the type of home they initially hoped to rent, followed by about a third (35%) who included a single-family detached house among the type of home they initially hoped to rent. Townhouses (10%), du/tri/fourplexes (7%), and another type of home (3%) followed.
Among renters who initially hoped to rent an apartment, the largest share included an apartment in a smaller building (42%) of less than 10 units among the type they hoped to rent. About a third (36%) hoped for a medium building of between 10 and 49 units, and a similar 33% said they hoped to rent in a larger building of 50 units or more.
Most renters who hoped to rent a single-family detached house (76%) ended up renting one, and the trend of renting what they hoped for is consistent for most home types: 76% of renters who hoped for an apartment in a large building got one, for example.
A majority of recent renters said in 2023 that they considered buying when they were looking for a home to rent: 64% said they at least thought about it, up from 56% in 2021, 55% in 2020, 49% in 2019, and 46% in 2018, but similar to 66% in 2022.
Younger renters were the most likely to say they considered buying: Most Gen Z (73%), Millennial (71%), and Gen X (60%) renters said so, significantly higher than the oldest generations of renters — about a third of Baby Boomer and Silent Generation renters (33%) said they at least thought about buying.
| Considered Buying | Total Renters | Gen Z (Ages 18-28) | Millennial (Ages 29-43) | Generation X (Ages 44-58) | Boomers + Silent Gen (Ages 59+) |
| Never considered buying | 34% | 27% | 29% | 40% | 67% |
| Seriously considered buying instead | 28% | 29% | 36% | 19% | 10% |
| Thought about buying, more serious about renting | 38% | 44% | 35% | 40% | 24% |
| NET: Considered buying | 66% | 73% | 71% | 60% | 33% |
| Considered Buying | Total Renters | 18-29 | 30-39 | 40-49 | 50-59 | 60+ |
| Never considered buying | 34% | 28% | 29% | 29% | 52% | 68% |
| Seriously considered buying instead | 28% | 28% | 36% | 32% | 14% | 10% |
| Thought about buying, more serious about renting | 38% | 43% | 35% | 39% | 35% | 23% |
| NET: Considered buying | 66% | 72% | 71% | 71% | 48% | 32% |
Similar both before and after the pandemic, recent renters consistently consider moving: 72% say they are considering it within the next 3 years. About a quarter (25%) say they are currently considering moving, and almost one in three (29%) say they’re considering moving in the next year. Another fifth (19%) say they’re considering it within the next two to three years. About one in ten (12%) say they might consider moving, but not within the next 3 years. And the remaining 15% say they have no plans to move.
| Moving Consideration | 2018 | 2019 | 2020 | 2021 | 2022 | 2023 |
| No plans to move | 20% | 20% | 19% | 17% | 15% | 15% |
| Might consider moving, but not within next 3 years | 12% | 14% | 12% | 14% | 12% | 12% |
| Considering moving in the next 2-3 years | 22% | 20% | 23% | 24% | 19% | 19% |
| Considering moving in the next year | 22% | 23% | 26% | 21% | 31% | 29% |
| Currently considering moving | 24% | 24% | 20% | 24% | 19% | 25% |
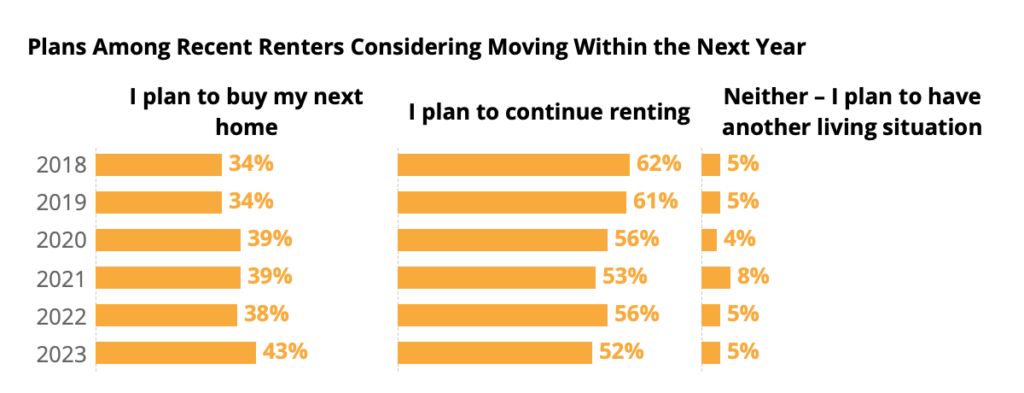
While recent renters are similarly likely to report plans to move as previous years, the share that say they plan to buy their next home rose in 2023 to 43% – up from 38% in 2022 and from 34% in 2018 and 2019. This increasing share of would-be buyers may represent increasing pent up demand for homeownership as more young adults desire the stability and customizability of homeownership in a housing market with rising costs and tight inventory.
Renters as a whole (not just recent renters) with plans to move in the next three years were only slightly more likely to say they planned to buy (46%) than those with plans to move within the next year (42%). For recent renters with plans to move in the next year, 38% said they planned to buy. For those that plan to move in the next three years, 44% said they plan to buy.
The typical recent renter surveyed in 2023 reported taking only one in-person tour. Going on at least two in-person tours is still quite common, however: 48% of recent renters reported taking at least two. Only about one in five (19%) recent renters forewent in-person tours entirely.
| Share of Recent Renters who Reported Taking | 2018 | 2019 | 2020 | 2021 | 2022 | 2023 |
| 0 In-Person Tours | 21% | 19% | 18% | 23% | 23% | 19% |
| 1-4 In-Person Tours | 62% | 63% | 67% | 68% | 71% | 74% |
| 5 or More In-Person Tours | 16% | 17% | 15% | 10% | 6% | 8% |
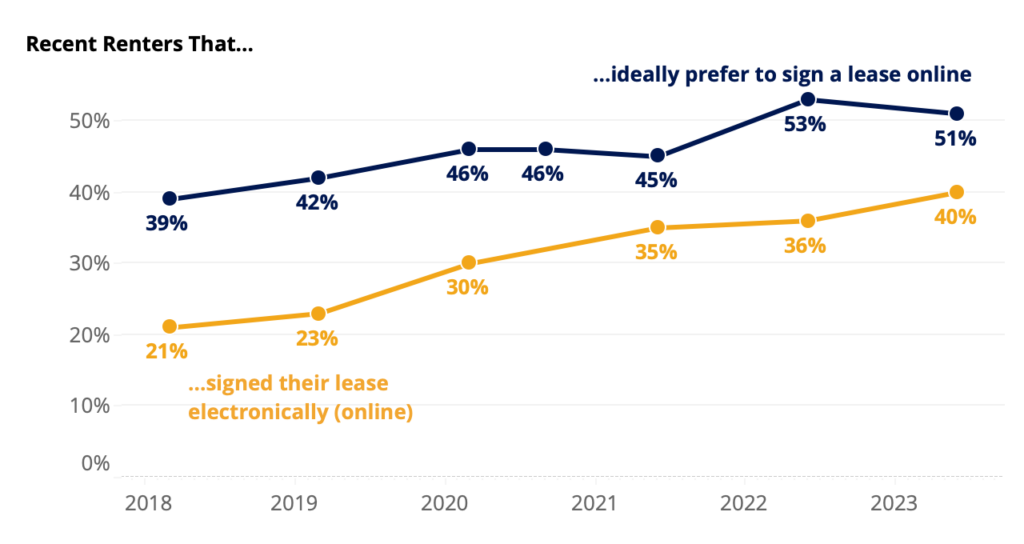
While the share of recent renters that signed their lease electronically stayed largely unchanged between 2018 and 2019 (21% and 23% respectively), 2020 saw a substantial increase to 30%, and the trend continued in the 2021 survey, where 35% of recent renters reported signing their leases electronically. In 2022, 36% of recent renters reported signing electronically – similar to 2021. 2023 saw that number increase to 40%. In-person leases are still the norm for a slim majority of renters (52%), but have been on a downward trend since at least 2019.
| Recent renters who signed their lease… | 2018 | 2019 | 2020 | 2021 | 2022 | 2023 |
| In-person (on paper) | 72% | 72% | 66% | 56% | 55% | 52% |
| Electronically (online) | 21% | 23% | 30% | 35% | 36% | 40% |
| We did not sign the lease | 7% | 5% | 5% | 9% | 8% | 8% |
The share of recent renters who actually signed electronically continues its gradual upward trend, and the share that would ideally prefer to sign electronically remained a majority – albeit slight – at 51%. Despite landlords and property managers stepping up their offering of electronic leasing options, the gap between the share of recent renters who signed online (40%) and would ideally prefer to sign online (51%) persits in 2023. However, this gap did shrink significantly, from a 17-point gap in 2022 to a 10-point one in 2023.
| Ideally prefer to do each online | Spring 2018 | Spring 2019 | Spring 2020 | Fall 2020 | Spring & Summer 2021 | Spring & Summer 2022 | Spring & Summer 2023 |
| Apply for a rental | 59% | 58% | 58% | 65% | 60% | 65% | 67% |
| Sign a Lease | 39% | 42% | 46% | 46% | 45% | 53% | 51% |
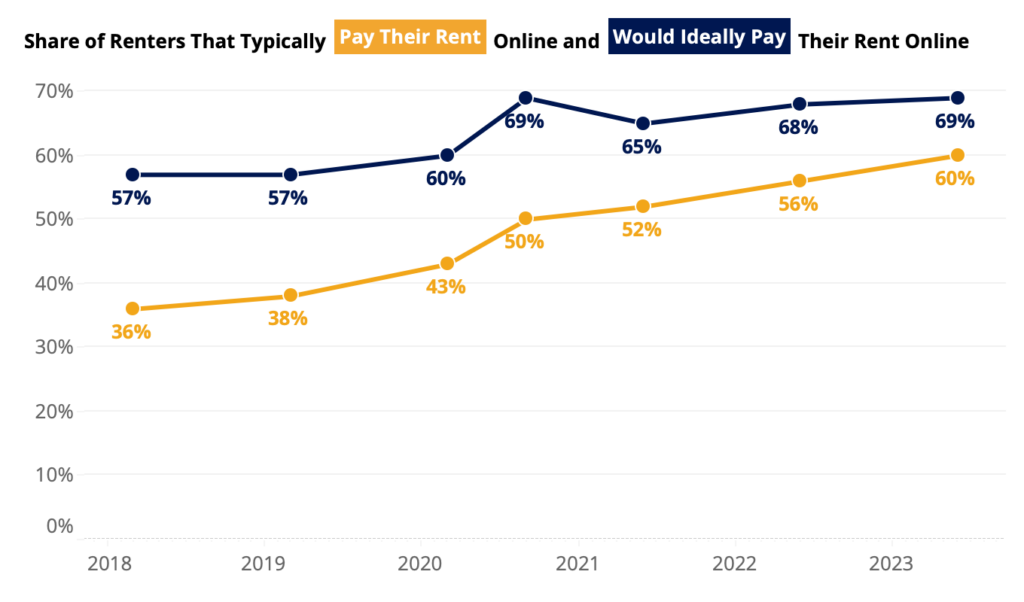
In fall of 2020, half (50%) of recent renters said they typically pay their rent online. Since then, the share has risen 10 points to 60%. Over the same time, the share of recent renters that said they would ideally prefer to pay their rent online remained similar: 69% in fall 2020 and 69% in spring/summer of 2023.
| Typically pay their rent… | Spring 2018 | Spring 2019 | Spring 2020 | Fall 2020 | Spring & Summer 2021 | Spring & Summer 2022 | Spring & Summer 2023 |
| In person | 49% | 48% | 43% | 41% | 38% | 37% | 34% |
| Online | 36% | 38% | 43% | 50% | 52% | 56% | 60% |
| Through the mail | 9% | 8% | 9% | 7% | 6% | 4% | 4% |
| Other | 6% | 6% | 5% | 3% | 3% | 3% | 3% |
| Would ideally pay their rent… | Spring 2018 | Spring 2019 | Spring 2020 | Fall 2020 | Spring & Summer 2021 | Spring & Summer 2022 | Spring & Summer 2023 |
| In person | 28% | 28% | 24% | 20% | 28% | 28% | 27% |
| Online | 57% | 57% | 60% | 69% | 65% | 68% | 69% |
| Through the mail | 7% | 7% | 7% | 6% | 5% | 2% | 2% |
| Other | 8% | 8% | 9% | 5% | 2% | 1% | 1% |
| Gap Between Share of Renters who Typically and Would Ideally Pay Rent Online (in percentage points) | ||||||
| Spring 2018 | Spring 2019 | Spring 2020 | Fall 2020 | Spring & Summer 2021 | Spring & Summer 2022 | Spring & Summer 2023 |
| 21% | 20% | 17% | 19% | 13% | 12% | 10% |
Among recent renters who recalled which concessions they received, 54% said they got at least one – similar to 55% in 2020. The most common perk that renters reported getting was parking — about a quarter (24%) said parking was included in their rental agreement. Frequency of most individual concessions stayed similar to 2021.
| Among recent renters who remember whether they got any concessions | 2020 | 2021 | 2022 | 2023 |
| First month rent free | 13% | 15% | 12% | 13% |
| More than first month rent free | 7% | 5% | 5% | 4% |
| Reduced rent | 12% | 13% | 12% | 13% |
| Parking | 19% | 25% | 24% | 25% |
| Reduced security deposit | 11% | 10% | 8% | 11% |
| Free/discounted access to paid property amenities (laundry, internet, etc…) | 10% | 12% | 11% | 2% |
| Broker’s fee paid | 5% | 4% | 3% | 4% |
| Gift card | 6% | 5% | 5% | 8% |
| Something else | 6% | 6% | 4% | 5% |
| I didn’t receive any concessions | 45% | 41% | 46% | 46% |
| Net: Received Concession | 55% | 59% | 54% | 54% |
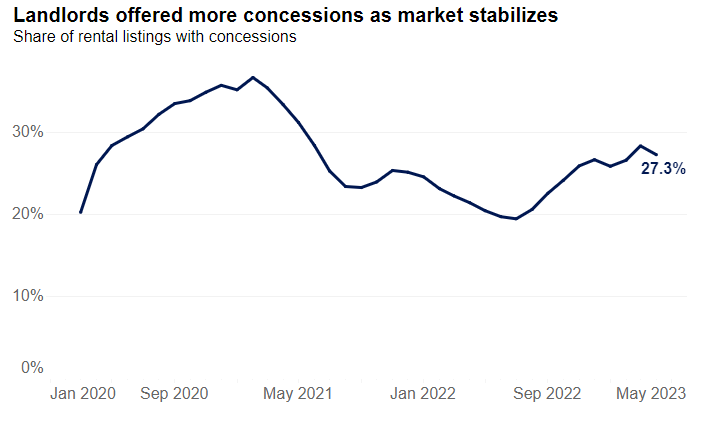
According to an analysis of Zillow rental listings, the share of listings that advertised at least one concession peaked in February 2021 (36%). By July 2022, that number had dropped to 19%, then rebounded to about 28% in March 2023. While around a quarter of Zillow listings over the past year advertised a concession in their description, closer to half of recent renters reported receiving one (54%) in our survey. This discrepancy suggests that many renters may be receiving un-advertised perks or concessions or negotiating them on their own.
The youngest generation of recent renters (those age 28 and younger) were the most likely to secure at least one perk or concession in their rental agreement: 60% reported doing so, similar to 57% of those between 29 and 43 years old, and higher than older generations.
| Among recent renters that remember whether they got any concessions | Gen Z (Ages 18-28) | Millennial (Ages 29-43) | Generation X (Ages 44-58) | Boomers + Silent Gen (59+) |
| Share that got at least 1 perk/concession | 60% | 57% | 44% | 34% |
Recent renters in large multifamily buildings were also more likely to report getting a concession: 64% said they did, compared to 41% of those in single-detached houses. Those in other home types were the middle ground: 57% reported getting at least one concession.
| Among recent renters who remember whether they got any concessions | Single-Family Detached House | Multifamily Apartment Building | Other |
| Share that got at least 1 perk/concession | 41% | 64% | 57% |
Renters in each of these groups associated with a higher likelihood of reporting a concession may not actually be more likely to receive each perk, like parking, but rather more likely to consider such a perk as something they cannot take for granted: Recent renters in single-detached houses, for example, may consider parking as a given, which may explain why 84% didn’t report receiving it as a concession or perk.
About a quarter (23%) of renters say that their lease allows them to leave with no more than a month of notice. For recent renters, the share is smaller: 14% of those that moved in the past year say their lease allows them to leave with no more than a month of notice.
Among renters on a fixed-term lease, two-thirds (67%) say they signed on for a 12-month duration. About one in five (20%) say their lease is longer than a year. Approximately one in ten (11%) say their lease is 2 years or longer, and one in seven (13%) say their lease is shorter than 12 months.
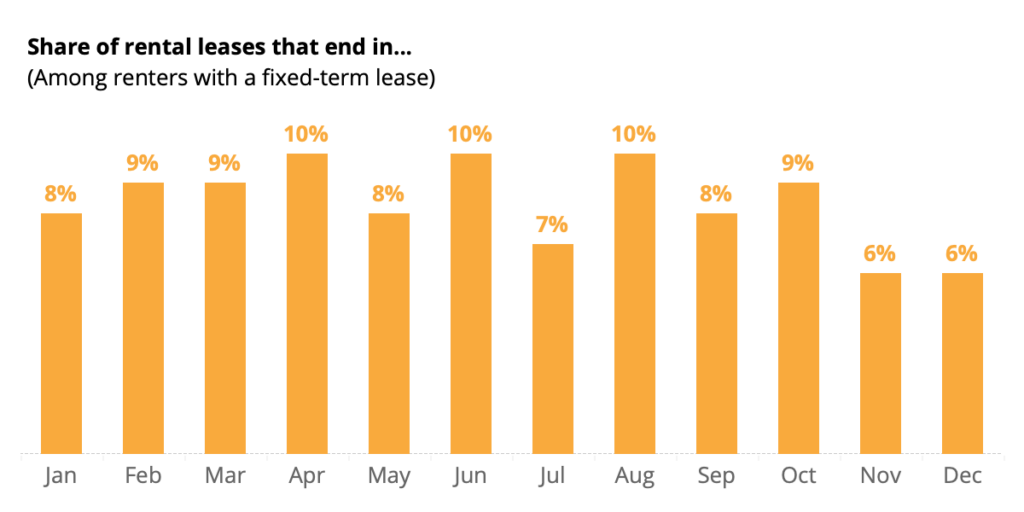
The smallest shares of renters report having a lease that terminates in November or December (both 6%), while the largest shares end in April, June and August (each 10%).
[1] 2022 Housing Vacancy Survey (HVS). 5.8% in 2022 represents the lowest rental vacancy rate since 5.7% in 1983.
[2] 2021 American Community Survey (ACS).
[3] Throughout this report, ‘typical’ refers to the median, unless otherwise specified.
[4] Renters were asked about their home’s square footage in ranges. According to the 2021 American Housing Survey, the median was 969 square feet and average was 1,148.
[5] Zillow Group Population Science defines Gen Z as those born between 1995 and 2003, Millennials between 1980 and 1994, Gen X between 1965 and 1979, Baby Boomers between 1945 and 1964, and Silent Generation in 1944 and earlier.
[6] LGBTQ+ renters are those who identified as gay, lesbian, bisexual, transgender, gender non-conforming/non-binary, intersex, or with another sexual orientation (other than straight) or gender identity (e.g. gender fluid, gender queer, gender neutral).
[7] Median household incomes are from U.S. Census Bureau, 2022 Current Population Survey Annual Social and Economic Supplement.
[8] The estimated share of all households with pets comes from American Housing Survey (AHS) 2021. These numbers are likely systematically low because of rising pet ownership during the pandemic. AHS also excludes service animals and livestock, whereas CHTR does not specify exclusions for any pets.
[9] The estimated shares of households (recent, tenured, all renters, and all households) with children comes from the 2022 Current Population Survey Annual Social and Economic Supplement.
[10] These higher fees and number of applications that renters of color disproportionately experience may at least be partially attributable to age, income, and geography: The typical renter of color is 2 years younger than the median white renter. White renters are more likely to rent in rural markets and the Midwest, both of which generally skew less expensive, while renters of color are more likely to rent in urban markets. Asian and Latinx renters in particular are more likely to rent in the West, which includes many of the country’s most expensive and competitive rental markets. Exploratory analyses of the data suggest that differences in region, urbanicity, age structure, and income explain about 10-20% of Latinx-white differences. Models, however, are underpowered for a more detailed accounting.
[11] 23% of tenured renters reporting a gym or fitness center – an increase from 16% in 2022, suggests that such facilities existed on rental properties, but tenured renters were unaware of them or were unable to access them (possibly a result of pandemic closures or capacity limits). It is unlikely that 7% of rental properties where tenured renters lived newly added gyms or fitness centers within the last year.
[12] Internal ZG page-view data show a substantial increase in the number of unique users viewing rental listings on mobile/tablet apps. However, mobile web views increased less substantially, and tablet web views decreased over the same period. Such a discrepancy could indicate that ZG competitors disproportionately received this mobile site growth, or that survey participants who used a mobile app were more likely to (mis)report using a mobile website.
