Renters: Results from the Zillow Consumer Housing Trends Report 2024

In this section, we provide a high-level overview of renters and what their homes look like. According to the Census Bureau 2022 American Community Survey, 35% of households live in rented homes. About a third of those rental households (33%) moved in the past year.
The demographic estimates in this section for “renters” and “renter households” represent the rental household decision makers (head of household, their spouse/partner, and roommates). In cases where a household has multiple decision makers, the demographic characteristics are representative of an average or midpoint of all decision makers in the rental household.
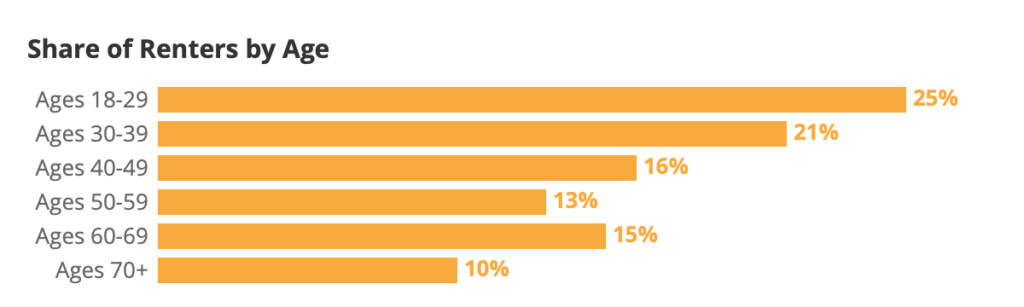
The median age of a renter is 42 years old and about half (46%) of renters are under the age of 40; only 10% of renters are in their seventies or older, and 15% are in their sixties. In other words, the age distribution of renters trends younger than the overall US population. Renters who did not move in the last year trend older than those who did move. The median age for a tenured renter is 44 years old– over a decade older than the typical renter who moved (31 years old).
| Age Group | Recent Renters | All Renters (including those that did not move) | Household Decision Makers | US Adults |
| Ages 18-29 | 47% | 25% | 12% | 20% |
| Ages 30-39 | 20% | 21% | 17% | 18% |
| Ages 40-49 | 12% | 16% | 16% | 16% |
| Ages 50-59 | 8% | 13% | 17% | 16% |
| Ages 60-69 | 8% | 15% | 18% | 15% |
| Ages 70+ | 4% | 10% | 19% | 15% |
Note: Household decision maker and US adult estimates from Census Bureau, 2023 Current Population Survey Annual Social and Economic Supplement
| Generation | Recent Renters | All Renters |
Household Decision Makers | US Adults |
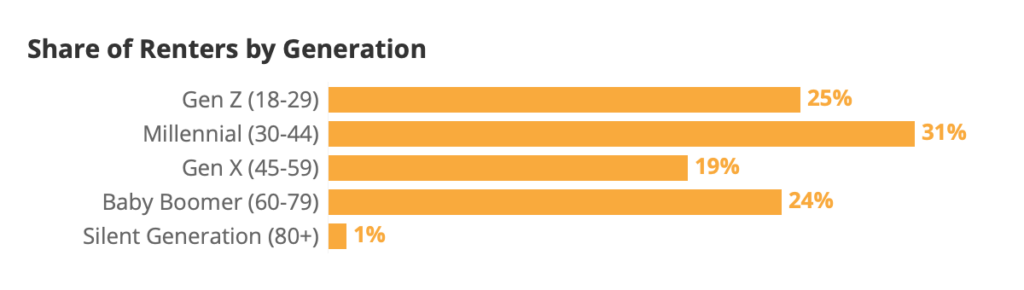
| Gen Z (18-29) | 47% | 25% | 12% | 20% |
| Millennial (30-44) | 28% | 31% | 26% | 26% |
| Gen X (45-59) | 12% | 19% | 25% | 23% |
| Baby Boomer (60-79) | 11% | 24% | 31% | 26% |
| Silent Generation (80+) | 1% | 1% | 6% | 5% |
Note: Household decision maker and US adult estimates from Census Bureau, 2023 Current Population Survey Annual Social and Economic Supplement
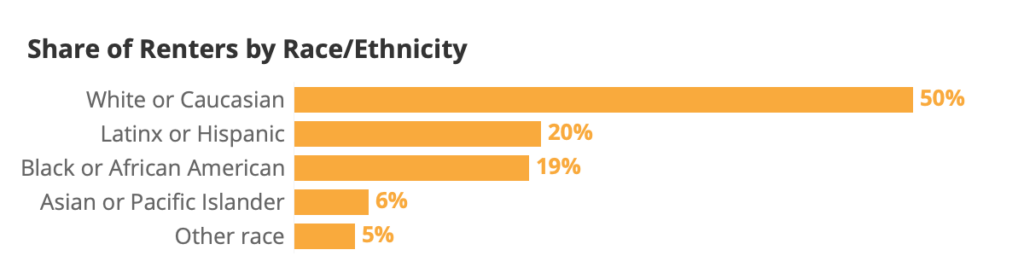
About half of renters are non-Hispanic white or Caucasian (50%), smaller than the share of the overall adult population that is white (60%). At the same time, 12% of adults identify as non-Hispanic Black or African American, while 19% of renters are Black.
| Race/ Ethnicity | Recent Renters | All Renters |
Household Decision Makers | US Adults |
| White or Caucasian | 54% | 50% | 63% | 60% |
| Black or African American | 15% | 19% | 12% | 12% |
| Latinx or Hispanic | 17% | 20% | 15% | 17% |
| Asian or Pacific Islander | 7% | 6% | 5% | 6% |
| Other race | 6% | 5% | 4% | 5% |
Note: Household decision maker and US adult estimates from Census Bureau, 2022 American Community Survey
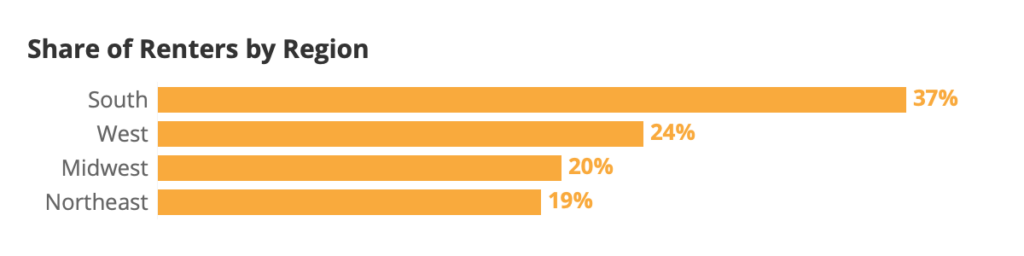
The largest share of renters live in the South (37%), followed by the West (24%), Midwest (20%) and Northeast (19%).
| Region | Recent Renters | All Renters |
Household Decision Makers |
US Adults |
| South | 43% | 37% | 39% | 39% |
| West | 25% | 24% | 22% | 24% |
| Midwest | 19% | 20% | 21% | 20% |
| Northeast | 14% | 19% | 17% | 17% |
Note: Household decision maker and US adult estimates from Census Bureau, 2023 Current Population Survey Annual Social and Economic Supplement
Approximately 12% of renters identify as LGBTQ+ in 2024?
In 2024, about 12% of renters identified as LGBTQ+. Over time this number has waxed and waned. About one in ten (11%) recent renters identified as LGBTQ+ in 2019, the first year CHTR asked about sexual orientation and gender identity, then 16% in 2020. The share that identified as LGBTQ+ peaked in 2021 at 22%. In 2022, 18% of recent renters identified as LGBTQ+, then 15% in 2023. Recent renters in 2024 are more likely to identify as LGBTQ+ (17%) than tenured renters (11%) or renters as a whole (12%).
Younger renters are more likely to self-identify as LGBTQ+: The median age of an LGBTQ+ renter is 33 versus 43 for cisgender heterosexual renters. Renters trending younger than the overall US adult population may help explain why renters are also more likely to identify as LGBTQ+.
Renters tend to have lower incomes than the population overall. The annual median income among renter households is approximately $51,300, compared to the overall national median of $74,600.
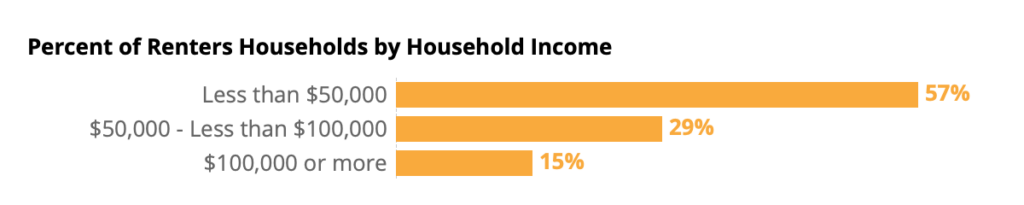
| Household Income | Recent Renter Households | All Renter Households | All US Households |
| Less than $50,000 | 53% | 57% | 34% |
| $50,000 – Less than $100,000 | 29% | 29% | 29% |
| $100,000 or more | 18% | 15% | 37% |
Source: All US household estimates from Census Bureau, 2023 Current Population Survey Annual Social and Economic Supplement
Renters as a whole tend to have a lower level of education to the overall adult population: Only 30% of renters have at least a four-year degree, lower than 35% of overall adults. Recent renters, however, are similarly likely to the overall adult population to have at least a four-year degree (35%).
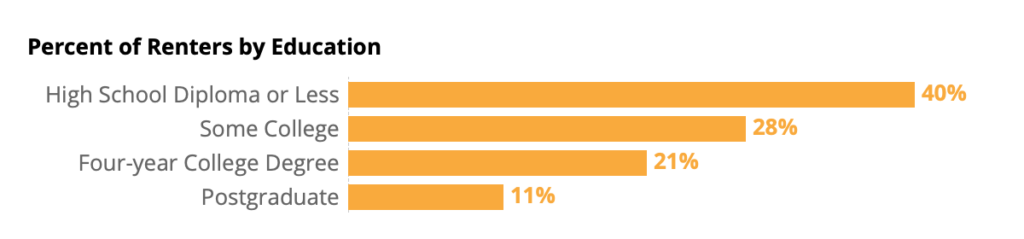
| Education | Recent Renters | All Renters | Household Decision Makers |
US Adults |
| High School Diploma or Less | 33% | 40% | 35% | 38% |
| Some College | 27% | 28% | 26% | 26% |
| Four-year College Degree | 26% | 21% | 24% | 22% |
| Postgraduate | 14% | 11% | 15% | 13% |
Source: Household decision maker and US adult estimates from Census Bureau, 2023 Current Population Survey Annual Social and Economic Supplement
Skewing younger than the adult population, renter households are less likely to be married or partnered. About half (46%) are single and never married, versus 25% of adults overall. This difference in relationship status may provide a partial explanation for the lower household income of renters compared with the overall population.
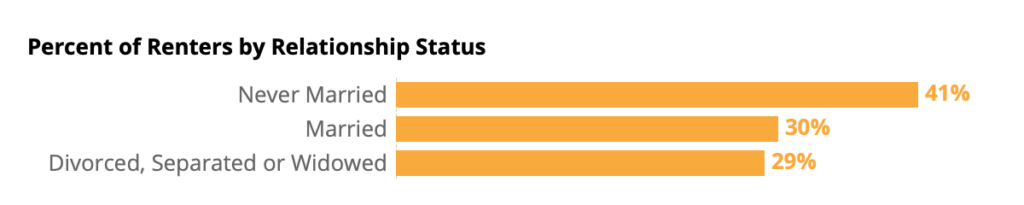
| Relationship Status | Recent Renters | All Renters | Household Decision Makers |
US Adults |
| Never Married | 46% | 41% | 20% | 25% |
| Married | 34% | 30% | 56% | 59% |
| Divorced, Separated, or Widowed | 20% | 29% | 24% | 16% |
Source: Household decision maker and US adult estimates from Census Bureau, 2023 Current Population Survey Annual Social and Economic Supplement
Renter households are more likely to report having at least one pet (58%) or plant (47%) than a child (33%). Renter households are slightly less likely to have a child than the adult population as a whole: 33% of renter households versus 36% of households overall.
| In Household | Recent Renter Households | Tenured Renter Households | All Renter Households | All Households | |
| Children under 18 | 33% | 33% | 33% | 36% | |
| Plant | 47% | 51% | 50% | – | |
| Dog | 39% | 37% | 37% | 38% | |
| Cat | 29% | 31% | 30% | 22% | |
| Another pet | 10% | 11% | 11% | 10% | |
| NET: Any pet | 58% | 58% | 58% | 50% | |
Apartments of various sizes are what most renters call home: 56% of renters report living in an apartment building. About one in four renters (23%) say they rent in a smaller-size apartment or condo building (fewer than 25 units). About one in eight (12%) said they live in a medium-size building (25-49 units), and 21% said they live in a larger multifamily building (50 units or more). In other words, about 32% of renters live in a multifamily building with at least 25 units. About 27% live in a single-family detached house.
| Home Type | Share of Renters |
| Apartment in a smaller size building (fewer than 25 units) | 23% |
| Apartment in a medium size building (25-49 units) | 12% |
| Apartment in a larger size building (50 units or more) | 21% |
| Single-family detached house | 27% |
| Townhouse / rowhouse | 7% |
| Duplex / triplex | 6% |
| Manufactured / mobile home | 3% |
| Room in shared housing | 1% |
| Boat, RV, van, etc. | <1% |
The typical (median) renter lives in a 2-bed, 1-bath apartment between 1,000 and 1,499 square feet.
Most recent renters moved from a previous rental (66%). Living with a friend or family member (18%) is more common for younger recent renters. For example, about one in four (24%) recent renters under age 30 reported moving from a home that a friend or family member rented or owned. Conversely, moving from a home they owned is more common for older recent renters; about one in six (16%) recent renters age 60 and older reported moving from a home they own, versus half that share (8%) for recent renters overall. A small 2% said they moved from group living quarters (e.g. dormitory, military barracks, nursing home, etc.), and the remaining 7% reported another type of living situation.
| Recent renter previous primary residence | 2018 | 2019 | 2020 | 2021 | 2022 | 2023 | 2024 |
| Owned | 10% | 9% | 9% | 11% | 7% | 8% | 8% |
| Rented | 70% | 73% | 73% | 63% | 67% | 67% | 66% |
| Lived with friend/family | 14% | 13% | 13% | 18% | 18% | 17% | 18% |
| Group quarters | 2% | 1% | 1% | 2% | 2% | 2% | 2% |
| Another living situation | 4% | 4% | 3% | 5% | 6% | 6% | 7% |
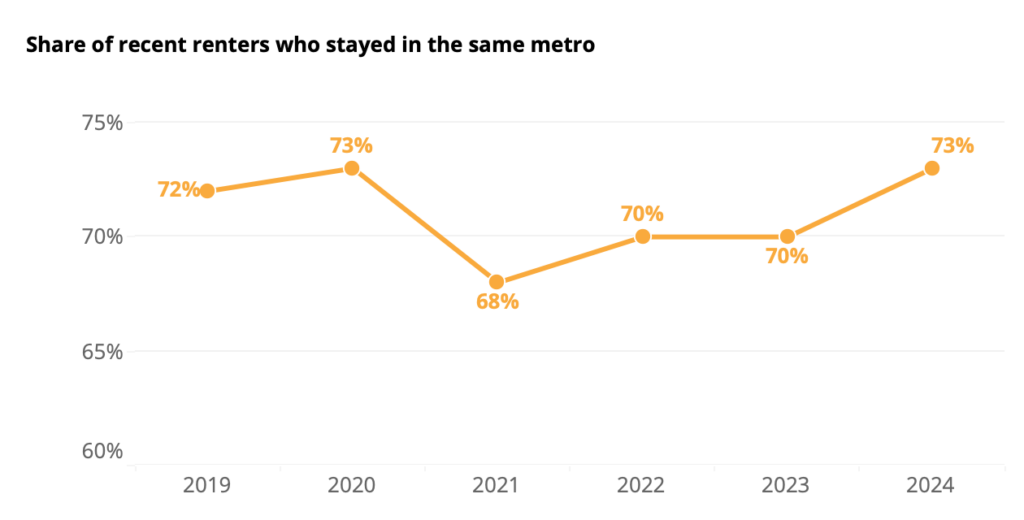
The largest share of recent renters said they stayed in the same city, but changed neighborhoods (39%). About one in ten (13%) reported staying in the same neighborhood as their previous home.
| Distance Moved | 2019 | 2020 | 2021 | 2022 | 2023 | 2024 |
| Same neighborhood | 16% | 14% | 11% | 11% | 12% | 13% |
| Same city, different neighborhood | 38% | 40% | 39% | 40% | 40% | 39% |
| Same metro, different city | 19% | 19% | 19% | 19% | 19% | 21% |
| Same state, different metro | 13% | 12% | 16% | 15% | 15% | 13% |
| Same country, different state | 13% | 13% | 13% | 13% | 13% | 14% |
| Moved from abroad | 2% | 2% | 2% | 3% | 2% | <1% |
In other words, about 73% of recent renters stayed within the same metro area. Over time, this number has largely stayed stable (72% in 2019, 73% in 2020, 68% in 2021, 70% in 2022, 70% in 2023).
The typical (median) recent renter submitted two applications — one online and one on paper/in person. For these rental applicants, the typical application fee to apply for their current rental was $50.
Paying a rental application fee was the norm across generations. However, younger renters were more likely to submit at least one application than their older counterparts. While most Gen Z (83%) and Millennial (81%) recent renters paid at least one application fee, smaller – albeit still high – shares of Gen X (73%) and Boomer & Silent Generation (73%) recent renters paid one.
| Age Group | Paid Any Application Fee | Paid At Least $40 | Paid At Least $100 |
| Recent Renters | 79% | 59% | 21% |
| Ages 18-29 | 84% | 64% | 22% |
| Ages 30-39 | 83% | 63% | 24% |
| Ages 40-49 | 76% | 51% | 17% |
| Ages 50-59 | 67% | 45% | 17% |
| Ages 60+ | 64% | 44% | 19% |
| Generation | Paid Any Application Fee | Paid At Least $40 | Paid At Least $100 |
| Recent Renters | 79% | 59% | 21% |
| Gen Z (Ages 18-29) | 84% | 65% | 22% |
| Millennial (Ages 30-44) | 82% | 60% | 22% |
| Gen X (Ages 45-59) | 67% | 46% | 17% |
| Baby Boomers & Silent Generation (Ages 60+) | 64% | 44% | 19% |
Note: Ages in parentheses indicate ages at the time of survey
The typical application fee amount that recent renters report paying is the same as in previous years (still a median of $50). However, the share that reported paying an application fee appears to have peaked in 2023 at 84% – falling to 79% in 2024.
Across racial groups, paying an application fee is more common than not, but renters of color are more likely to report paying one: Larger shares of Black (84%) and Hispanic/Latinx (82%) recent renters reported paying an application fee than white renters (77%). Hispanic/Latinx recent renters were also about twice as likely as their non-hispanic white counterparts to report submitting 5 applications or more (27% Latinx recent renters reported submitting 5 or more, compared to 13% of white renters).
Recent renters of color also reported paying higher total amounts in application fees: The typical white renter reported paying $50 in application fees across all the rentals they applied for, while the typical Black ($70), Latinx ($100), and Asian ($95) recent renters all reported spending higher amounts.
| Recent renters that paid an application fee to secure their current rental | |||
| Race/Ethnicity | Paid Fee | Paid At Least $40 | Paid At Least $100 |
| Recent Renters | 79% | 59% | 21% |
| White, non-Hispanic | 77% | 57% | 20% |
| Black, non-Hispanic | 84% | 58% | 18% |
| Hispanic/Latinx | 82% | 63% | 27% |
| AAPI, non-Hispanic | 81% | 68% | 24% |
| Net: Nonwhite | 82% | 61% | 23% |
| Application fees paid to secure their current rental | ||||
| Race/Ethnicity | Median | Median among those who paid fee | Average | Average among those who paid fee |
| Recent Renters | $50 | $50 | $69 | $88 |
| White | $50 | $50 | $67 | $89 |
| Black | $49 | $50 | $63 | $76 |
| Hispanic/Latinx | $50 | $50 | $80 | $98 |
| AAPI | $50 | $50 | $66 | $81 |
| Net: Nonwhite | $50 | $50 | $71 | $87 |
| Sum of all application fees paid during their rental search | ||||
| Race/Ethnicity | Median | Median among those who paid fee | Average | Average among those who paid fee |
| Recent Renters | $50 | $75 | $100 | $123 |
| White | $50 | $75 | $96 | $123 |
| Black | $50 | $70 | $93 | $108 |
| Hispanic/Latinx | $75 | $100 | $114 | $137 |
| AAPI | $60 | $80 | $95 | $114 |
| Net: Nonwhite | $60 | $80 | $103 | $124 |
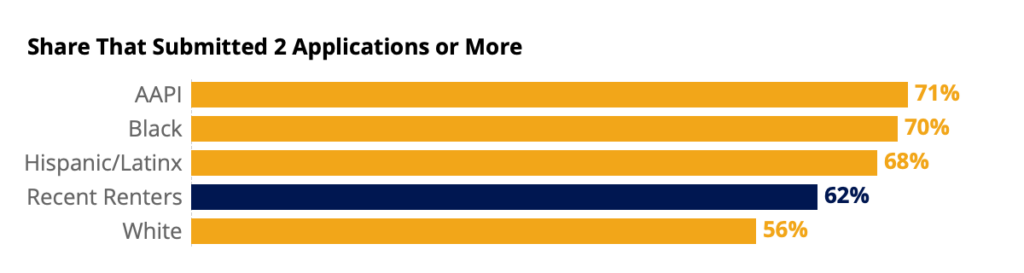
| Race/Ethnicity | Submitted 1+ applications | Submitted 2+ applications | Submitted 5+ applications |
| Recent Renters | 86% | 62% | 14% |
| White | 84% | 56% | 13% |
| Black | 93% | 70% | 18% |
| Hispanic/Latinx | 90% | 68% | 16% |
| AAPI | 86% | 71% | 9% |
| Net: Nonwhite | 75% | 68% | 14% |
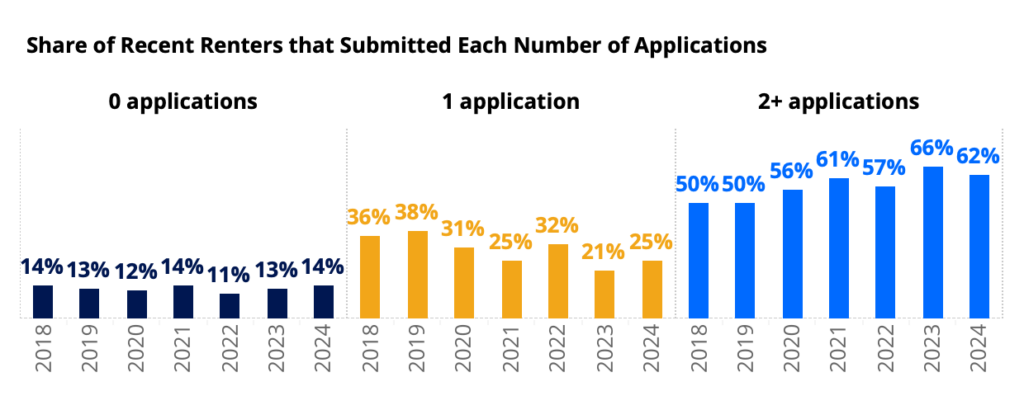
| Recent Renters that Submitted | 2018 | 2019 | 2020 | 2021 | 2022 | 2023 | 2024 |
| 0 applications | 14% | 13% | 12% | 14% | 11% | 13% | 14% |
| 1 application | 36% | 38% | 31% | 25% | 32% | 21% | 25% |
| 2+ applications | 50% | 50% | 56% | 61% | 57% | 66% | 62% |
Renters in large multifamily buildings (those with 50 units or more) were most likely to report submitting at least one application: 93% do, compared with 72% of those in single-family detached houses and similar to 90% of those renting other home types.
| Type of Home Rented | Submitted At Least 1 Application | Paid Any Application Fee | Paid At Least $40 | Paid At Least $100 |
| Recent Renters | 86% | 79% | 59% | 21% |
| Multifamily (25-49 units) | 92% | 93% | 70% | 19% |
| Large Multifamily (50+ units) | 93% | 88% | 71% | 28% |
| Single-family detached | 72% | 69% | 51% | 18% |
| Other | 87% | 76% | 54% | 19% |
| Median | Average | |||
| Type of Home Rented | Median application fee to secure rental | Median among renters who paid one | Mean application fee to secure rental | Mean among renters who paid one |
| Recent Renters | $50 | $50 | $69 | $88 |
| Multifamily (25-49 units) | $50 | $50 | $79 | $86 |
| Multifamily (50+ units) | $50 | $50 | $89 | $101 |
| Single-family detached | $35 | $50 | $57 | $85 |
| Other | $45 | $50 | $65 | $78 |
For renters who paid one, the typical security deposit reported in 2024 was $750.
The oldest generations of renters are the most likely to avoid paying a deposit entirely: 80% of Baby Boomer and SIlent Generation renters reported paying a security deposit — lower than 88% of Gen Z and 89% of Millennial renters.
| Generation | Share that Paid a Security Deposit |
| Recent Renters | 87% |
| Gen Z (Ages 18-29) | 88% |
| Millennial (Ages 30-44) | 89% |
| Gen X (Ages 45-59) | 83% |
| Baby Boomers & Silent Generation (Ages 60+) | 80% |
| Age Group | Share that Paid a Security Deposit |
| Recent Renters | 87% |
| Ages 18-29 | 88% |
| Ages 30-39 | 90% |
| Ages 40-49 | 86% |
| Ages 50-59 | 81% |
| Ages 60+ | 80% |
Renters of color are more likely to report paying a security deposit: 87% do, compared to 84% of white renters. Latinx and Asian American/Pacific Islander renters are more likely to pay a more expensive deposit: 39% of Latinx and 43% of AAPI renters paid at least $500 for their deposit, and 22% of Latinx and 30% of AAPI renters paid at least $1,000.
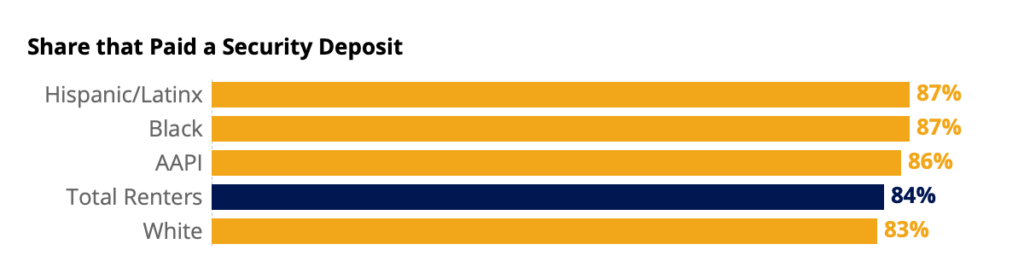
| Race/ Ethnicity | Paid Any Security Deposit | Deposit of At Least $500 | Deposit of At Least $1,000 |
| Total Renters | 84% | 34% | 20% |
| White | 83% | 31% | 17% |
| Black | 87% | 31% | 16% |
| Hispanic/Latinx | 87% | 42% | 26% |
| AAPI | 86% | 49% | 34% |
| Net: Nonwhite | 86% | 38% | 22% |
Regardless of the type of home rented, paying a deposit is the norm: 87% of recent renters reported paying one – as did 85% of renters overall.
Renters in single-family detached houses, though, were slightly more likely to avoid paying a deposit: 19% of single-family renters reported paying no security deposit – higher than 14% of renters in other home types. When they don’t avoid paying one, single-family deposit amounts are typically higher: The typical security deposit among single-family renters who pay one was $1,000 – higher than the median for renters in multifamily ($530) and other types ($750) of buildings. A lower likelihood of paying an application fee (which often includes a credit check) combined with the fact that single-family renters are more likely to rent from a private owner (who may be less able to offset risk from a single tenant than a professional management company) likely contribute to this difference.
| Type of Home Rented | Paid Any Security Deposit | Median Security Deposit | Median Among Renters Who Paid One | Paid At Least $500 | Paid At Least $1,000 |
| Total Renters | 85% | $750 | $800 | 35% | 20% |
| Multifamily (50+ units) | 86% | $500 | $530 | 31% | 19% |
| Single-family detached | 81% | $850 | $1,000 | 43% | 26% |
| Other | 86% | $600 | $750 | 32% | 18% |
Three quarters of renters (75%) said that paying their first month’s rent was required to secure their rental. However, only a quarter (25%) said they had to pay their last month’s rent to secure their rental.
By race, the requirement that renters pay their first month’s rent was largely consistent. Requiring last month’s rent, however, was disproportionately common for Black and Hispanic/Latinx renters, and less common for white renters.
| Required to secure rental | ||
| Race/ Ethnicity | First month’s rent | Last month’s rent |
| Total Renters | 75% | 25% |
| White | 74% | 22% |
| Black | 74% | 28% |
| Hispanic/Latinx | 76% | 29% |
| AAPI | 76% | 26% |
| Net: Nonwhite | 75% | 28% |
Among recent renters who moved from a previous rental, about two in every five (40%) reported getting their entire deposit back. About one in five (18%) said they got most of it back, 9% say they got some of it, and another quarter (24%) say they did not get any of their deposit back. The remaining tenth (9%) say they never paid a deposit at their previous rental. White recent renters were more likely to say that they never paid a deposit at their previous rental (11% of white recent renters versus 8% of recent renters of color).
Renters who documented their previous rental’s move-in condition were more likely to get at least some of their deposit back. For example, renters that took photos were 6 points more likely to get at least some of their deposit back (76% versus 70% of those that did not take photos).
Renters who documented by taking photos, video, completing a condition checklist, AND telling their landlord/property manager were the most likely to get at least some of their deposit back (80%) and have their deposit returned in its entirety (50%).
| Among renters who paid a deposit at their previous rental | Photos | Video | Property condition checklist | Told landlord/ property manager | Any | All | None |
| Entire deposit returned | 42% | 41% | 43% | 42% | 45% | 50% | 41% |
| At least some deposit returned | 76% | 77% | 77% | 76% | 75% | 80% | 64% |
| No deposit returned | 24% | 23% | 23% | 24% | 25% | 20% | 37% |
About two in five (41%) recent renters who moved from a previous rental say they disagreed with their landlord or property manager about something. About a fifth (19%) said they disagreed about repair, damage or maintenance on the property and a sixth (16%) disagreed about move-out costs or fees and one in seven (17%) on the responsibility for utility payments like electricity, heat, gas, or internet.
A majority (58%) of renters reported paying at least one kind of additional fee on their rental. The most common fee was a water, sewer, garbage, recycling, or other utility fee (41%), followed by a payment processing fee (27%).
Most renters who pay these fees say they are mandatory or unavoidable. For example, 64% of renters who pay a utility fee to their landlord or property management company say tenants must pay rental utility fees, and do not have the option to pay utility companies directly. Regarding payment processing fees, 56% of renters who pay them say that such fees are unavoidable and that there is no option to pay rent without paying a payment processing fee.
Paying at least one of these fees is the norm for most renters across race and ethnicity. However, renters of color are slightly more likely to report paying at least one. About half of white renters (54%) reported that they pay at least one, whereas 63% of Hispanic/Latinx, 60% of Black, and 63% of Asian American/Pacific Islander renters said the same.
| Renters who report paying | Total Renters | White | Black | Hispanic/ Latinx | AAPI | Nonwhite |
| Valet trash | 18% | 18% | 17% | 20% | 23% | 18% |
| Utility fee | 41% | 39% | 41% | 44% | 46% | 43% |
| Amenity fee | 16% | 13% | 17% | 19% | 24% | 18% |
| Internet fee | 20% | 19% | 19% | 24% | 26% | 22% |
| Payment processing fee | 27% | 23% | 31% | 30% | 32% | 30% |
| At least 1 | 58% | 54% | 60% | 63% | 63% | 61% |
Like with application fees and other upfront rental costs, age plays a part; younger renters are more likely to report paying each fee, with renters under 30 (74%) being almost twice as likely as than renters age 60 and older (39%) to report paying one.
| Renters who report paying | Total Renters | Gen Z (Ages 18-29) | Millennial (Ages 30-44) | Generation X (Ages 45-59) | Boomers + Silent Gen (60+) |
| Valet trash | 18% | 24% | 22% | 14% | 11% |
| Utility fee | 41% | 56% | 46% | 33% | 26% |
| Amenity fee | 16% | 25% | 18% | 11% | 7% |
| Internet fee | 20% | 32% | 24% | 15% | 9% |
| Payment processing fee | 27% | 38% | 32% | 21% | 14% |
| At least 1 | 58% | 74% | 65% | 50% | 39% |
| Renters who report paying | Total Renters | 18-29 | 30-39 | 40-49 | 50-59 | 60+ |
| Valet trash | 18% | 24% | 22% | 20% | 14% | 11% |
| Utility fee | 41% | 56% | 48% | 41% | 32% | 26% |
| Amenity fee | 16% | 25% | 20% | 14% | 10% | 7% |
| Internet fee | 20% | 32% | 24% | 20% | 15% | 9% |
| Payment processing fee | 27% | 38% | 34% | 27% | 19% | 14% |
| At least 1 | 58% | 74% | 67% | 59% | 48% | 39% |
Nearly all renters (94%) agree that rental listings should clearly list all fees. About nine in ten (90%) think that renters should be able to opt out of fees for services they do not use. And 77% said that rental fees should be included in the total rent, rather than charged separately.
About half of renters (48%) say that they have renters insurance – higher than the approximate third (32%) who say that their landlord or property manager requires renters insurance.
| Total Renters | Single-family detached house | Multifamily (50+ units) | Another type of home | |
| Has renters insurance | 48% | 46% | 55% | 47% |
| Required to have renters insurance | 32% | 27% | 42% | 31% |
The share of recent renters who say they searched on a mobile website held onto its increase from 2021: (75% in 2024, 74% in 2023 & 2022, and 2021, up from 65% in 2020) and/or on a mobile app (64% in 2024, 63% in 2023, 60% in 2022 & 2021, up from 51% in 2020).
| Online resources recent renters used when searching | 2019 | 2020 | 2021 | 2022 | 2023 | 2024 |
| Website on a laptop / desktop computer | 70% | 72% | 73% | 67% | 68% | 68% |
| Mobile website on a smartphone / tablet | 64% | 65% | 74% | 74% | 74% | 75% |
| App on a smartphone / tablet | 46% | 51% | 60% | 60% | 63% | 64% |
| Number of sites/apps recent renters used when searching | 2019 | 2020 | 2021 | 2022 | 2023 | 2024 |
| 0 sites/apps | 16% | 13% | 11% | 10% | 9% | 11% |
| 1-4 sites/apps | 26% | 25% | 28% | 39% | 35% | 37% |
| 5-9 sites/apps | 34% | 36% | 37% | 34% | 34% | 35% |
| 10+ | 24% | 26% | 23% | 16% | 22% | 16% |
| Median number of sites/apps used | 5 | 6 | 6 | 5 | 5 | 5 |
About four in five renters (79%) said that one or more digital features was “essential” when deciding which home to rent. Just over half (56%) considered seeing pictures essential. Seeing a floor plan (49%) followed. Renters were less likely to say the same about taking a 3D/virtual tour of the rental home (25%) and watching a recorded video tour of the home (20%).
About two thirds of renters (66%) said that seeing lease terms, rent amount and fees were essential. And 62% said the same about taking a private tour. Renters were more split about meeting or speaking with the landlord or property manager (55%) and about a third (35%) said that seeing reviews of the property manager / landlord was essential.
When asked what encouraged them to stay at their current rental, tenured renters were most likely to say that their rental costs were a good deal (72%), followed by quiet neighbors (69%) and not being able to afford to move somewhere else (68%). Smaller shares cited the property being well maintained (66%), a floor plan or layout that fit their preferences (65%), liking their landlord or property manager (62%), the property allowing pets (60%) , and private outdoor space (52%). Tenured renters were least likely to cite their rental’s common amenities like a gym or conference room (37%) as encouragement for staying put.
About two thirds of tenured renters (66%) say that their landlord or property manager notified them of a rent increase in the past 2 years. Of the 34% that said their rent has not increased, however, half (50%) cite their landlord not wanting to find a new tenant as a reason. Less common reasons included some kind of rent control or stabilization (35%) and the home being in disrepair (10%).
Just under half (44%) of renters said they had passed on a particular property because it prohibited pets. And about a third (32%) said the same about a property with restrictions on pet breed and/or size. About a quarter (25%) said they had passed on a property because it did not offer the option to apply online.
Most recent renters (72%) said they considered a spouse, partner, roommate, friend, relative/family member, and/or their children as a co-shopper while they searched for a rental.
Younger renters (78% of recent renters under 30, 73% of renters in their 30s), renters of color (75%), higher income renters (83% of recent renters with a household income of at least $100,000), and single-family renters (81%) were all more likely to report at least one co-shopper.
| Coshopped with | Recent Renters | Single- family detached house | Multifamily (in 50+ unit building) | Another type of home |
| Spouse/partner | 31% | 49% | 40% | 40% |
| Roommates | 8% | 12% | 7% | 10% |
| Friends | 5% | 5% | 5% | 7% |
| Relatives/family members | 17% | 17% | 16% | 12% |
| My children | 15% | 18% | 19% | 14% |
| Someone else not listed above | 1% | 1% | 1% | 1% |
| None of the above – I did not co-shop with anyone | 37% | 19% | 29% | 32% |
Most recent renters (69%) said that at least one spouse, partner, roommate, friend, child, pet, or someone else influenced which home they ultimately rented.
| Influenced which home they ultimately rented | Recent Renters | Single- family detached house | Multifamily (in 50+ unit building) | Another type of home |
| Spouse/partner | 22% | 32% | 30% | 25% |
| Roommates | 3% | 8% | 5% | 6% |
| Friends | 9% | 12% | 10% | 12% |
| Relatives/family members | 16% | 22% | 14% | 13% |
| My children | 14% | 18% | 14% | 15% |
| My pets | 13% | 15% | 12% | 15% |
| Someone else not listed above | 2% | 4% | 2% | 2% |
| None of the above – No one influenced which home I ultimately decided to rent | 38% | 22% | 38% | 32% |
When asked what home characteristics they are most likely to consider very or extremely important, renters have consistently said that staying within their initial budget is highly important. The largest majority (86%) said so, higher than any other home characteristic.
Preferred number of bedrooms was the runner-up, at a distant 69%. Preferred number of bathrooms (51%) and floor plan/layout (49%) followed.
| Share of Renters that Consider each Home Characteristic Very or Extremely Important | |
| Was within my initial budget | 86% |
| Had preferred number of bedrooms | 69% |
| Had preferred number of bathrooms | 51% |
| Had a floor plan / layout that fit my preferences | 49% |
| Other shared amenities (e.g. pet area, business center, conference room) | 16% |
| Shared fitness center or gym | 15% |
| Shared community recreation space (e.g. game room, movie theater) | 14% |
| Rooftop deck or garden | 13% |
| Recent renter very/extremely important home characteristics | 2018 | 2019 | 2020 | 2021 | 2022 | 2023 | 2024 |
| Was within my initial budget | 82% | 85% | 82% | 81% | 79% | 82% | 89% |
| Had preferred number of bedrooms | 65% | 68% | 66% | 64% | 67% | 68% | 70% |
| Had preferred number of bathrooms | 45% | 48% | 46% | 44% | 47% | 56% | 50% |
| Had a floor plan / layout that fit my
preferences |
40% | 40% | 42% | 45% | 49% | 55% | 49% |
| Shared fitness center or gym | 17% | 20% | 23% | 17% | 15% | 24%
|
18% |
| Shared community recreation space (e.g. game
room, movie theater) |
15% | 15% | 18% | 16% | 12% | 21%
|
16% |
| Rooftop deck or garden | 13% | 14% | 18% | 16% | 15% | 21%
|
14% |
| Other shared amenities (e.g. pet area, business
center, conference room) |
14% | 17% | 20% | 19% | 15% | 25%
|
19% |
A near-unanimous share of renters (95%) said they consider staying within their initial budget as “essential” – higher than any other characteristic we asked about. Preferred neighborhood/location (83%), preferred number of bedrooms (82%), bathrooms (65%), and floor plan/layout (67%) all trailed. Most also said that broadband internet was essential (63%), while closer to half (51%) said the same about gigabit internet speeds. A smaller share (43%) said that having 2 or more internet providers to choose from was essential.
| Consider each “essential” when deciding whether to rent a property | Total Renters | Single- family detached house | Multifamily (in 50+ unit building) | Another type of home |
| Within my initial budget | 95% | 95% | 95% | 93% |
| Preferred neighborhood and/or location | 83% | 83% | 86% | 80% |
| Preferred number of bedrooms | 82% | 85% | 82% | 82% |
| Floor plan / layout that fits my preferences | 67% | 66% | 73% | 65% |
| Preferred number of bathrooms | 65% | 71% | 68% | 68% |
| Broadband internet | 63% | 63% | 67% | 61% |
| Allows pets | 60% | 67% | 57% | 64% |
| Gigabit internet | 51% | 53% | 52% | 55% |
| 2 or more internet providers to choose from | 43% | 43% | 43% | 42% |
| Home is newly built or recently renovated | 38% | 36% | 44% | 38% |
| Common building amenities (e.g. gym, business center, rooftop, lounge, etc) | 33% | 28% | 45% | 29% |
Recent renters surveyed in 2024 reported high importance of the neighborhood characteristics we asked about at similar levels to previous years. Recent renters were most likely to place high importance on their commute (56%) and neighborhood walkability (55%).
| Share of Recent Renters that Consider each Neighborhood Characteristic Very or Extremely Important | 2018 | 2019 | 2020 | 2021 | 2022 | 2023 | 2024 |
| Close to family and/or friends | 36% | 37% | 38% | 39% | 37% | 39% | 39% |
| Close to shopping, services, and/or leisure activities | 47% | 50% | 51% | 49% | 49% | 56% | 53% |
| Close to public transportation | 36% | 35% | 34% | 31% | 33% | 37% | 33% |
| My commute to work or school | 58% | 57% | 55% | 52% | 56% | 59% | 56% |
| In a walkable neighborhood | 55% | 56% | 55% | 56% | 57% | 61% | 55% |
| Offered a sense of community or belonging | 33% | 34% | 34% | 35% | 39% | 42% | 39% |
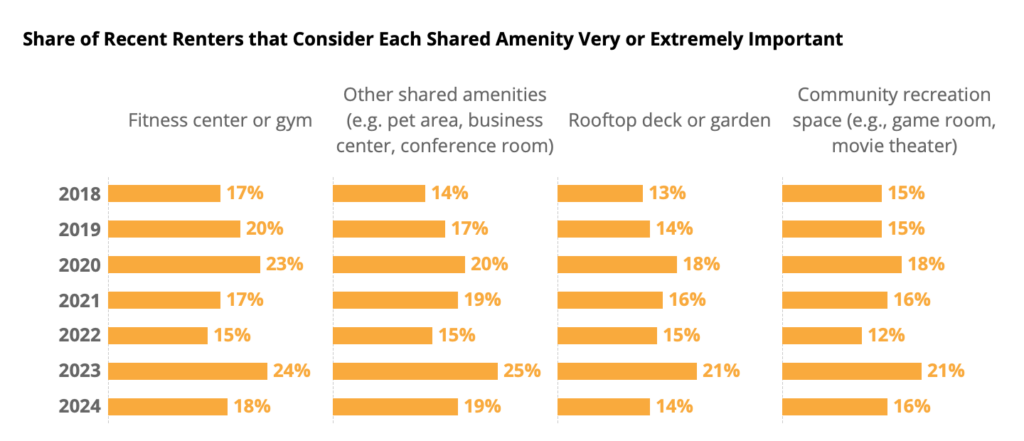
About a fifth of recent renters said a fitness center or gym (18%) or other shared amenities like a pet area, business center or conference room (19%) were very or extremely important. Smaller shares said the same about a community recreation space (16%) and a rooftop deck or garden (14%).
Overall, almost 2 in 5 (38%) recent renters considered at least 1 common amenity as highly important, and that number is closer to half (49%) for recent renters in large, 50-unit-or-more multifamily buildings.
| Share of Recent Renters that Consider each Very or Extremely Important | 2018 | 2019 | 2020 | 2021 | 2022 | 2023 | 2024 |
| Community recreation space (e.g., game room, movie theater) | 15% | 15% | 18% | 16% | 12% | 21% | 16% |
| Fitness center or gym | 17% | 20% | 23% | 17% | 15% | 24% | 18% |
| Rooftop deck or garden | 13% | 14% | 18% | 16% | 15% | 21% | 14% |
| Other shared amenities (e.g. pet area, business center, conference room) | 14% | 17% | 20% | 19% | 15% | 25% | 19% |
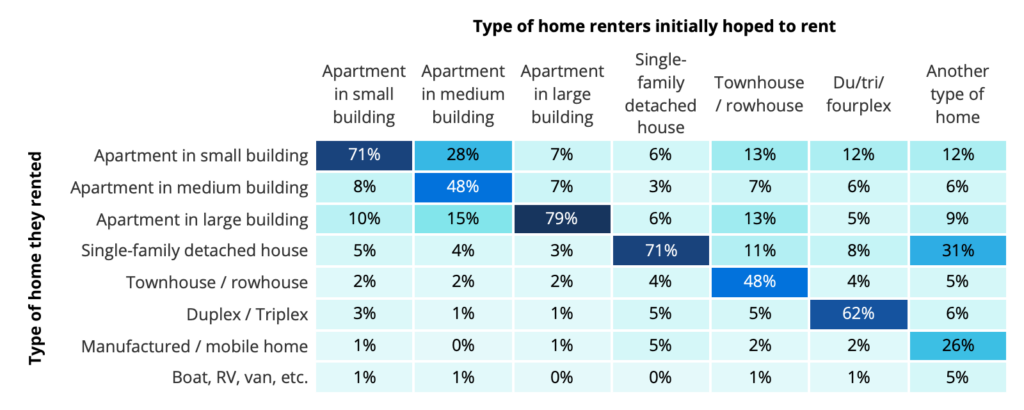
Most renters (56%) included an apartment among the type of home they initially hoped to rent, followed by about a third (33%) who included a single-family detached house. Townhouses (10%), du/tri/fourplexes (7%), and another type of home (4%) followed.
Most renters who hoped to rent a single-family detached house (71%) ended up renting one, and the trend of renting what they hoped for is consistent for most home types: 79% of renters who hoped for an apartment in a large building got one, for example.
| Type of home renters initially hoped to rent | |||||||
| Type of home they rented | Apartment in small building | Apartment in medium building | Apartment in large building | Single- family detached house | Townhouse / rowhouse | Du/tri/ fourplex | Another type of home |
| Apartment in small building | 71% | 28% | 7% | 6% | 13% | 12% | 12% |
| Apartment in medium building | 8% | 48% | 7% | 3% | 7% | 6% | 6% |
| Apartment in large building | 10% | 15% | 79% | 6% | 13% | 5% | 9% |
| Single-family detached house | 5% | 4% | 3% | 71% | 11% | 8% | 31% |
| Townhouse / rowhouse | 2% | 2% | 2% | 4% | 48% | 4% | 5% |
| Duplex / Triplex | 3% | 1% | 1% | 5% | 5% | 62% | 6% |
| Manufactured / mobile home | 1% | 0% | 1% | 5% | 2% | 2% | 26% |
| Boat, RV, van, etc. | 1% | 1% | 0% | 0% | 1% | 1% | 5% |
A majority of recent renters said in 2024 that they considered buying when they were looking for a home to rent: 58% said they at least thought about it, up from 56% in 2021, 55% in 2020, 49% in 2019, and 46% in 2018, but lower than historic peaks at 64% in 2023 and 66% in 2022.
| Recent renter homebuying consideration | 2018 | 2019 | 2020 | 2021 | 2022 | 2023 | 2024 |
| Never considered buying | 54% | 51% | 45% | 44% | 34% | 36% | 42% |
| Seriously considered buying instead | 19% | 21% | 24% | 23% | 24% | 26% | 22% |
| Thought about buying, more serious about renting | 27% | 27% | 31% | 34% | 42% | 38% | 36% |
| NET: Considered buying | 46% | 49% | 55% | 56% | 66% | 64% | 58% |
Younger renters were the most likely to say they considered buying: Most Gen Z (64%), Millennial (63%), and Gen X (53%) renters said so, significantly higher than the oldest generations of renters — about a third of Baby Boomer and Silent Generation renters (34%) said they at least thought about buying.
| Considered Buying | Recent Renters | Gen Z (Ages 18-29) | Millennial (Ages 30-44) | Generation X (Ages 45-59) | Boomers + Silent Gen (Ages 60+) |
| Never considered buying | 42% | 36% | 37% | 47% | 66% |
| Seriously considered buying instead | 22% | 27% | 23% | 17% | 11% |
| Thought about buying, more serious about renting | 36% | 38% | 40% | 36% | 23% |
| NET: Considered buying | 58% | 64% | 63% | 53% | 34% |
| Considered Buying | Recent Renters | 18-29 | 30-39 | 40-49 | 50-59 | 60+ |
| Never considered buying | 42% | 35% | 39% | 37% | 56% | 66% |
| Seriously considered buying instead | 22% | 27% | 22% | 21% | 12% | 10% |
| Thought about buying, more serious about renting | 36% | 38% | 39% | 41% | 31% | 24% |
| NET: Considered buying | 58% | 65% | 61% | 63% | 44% | 34% |
While recent renters considering moving is still the norm (58% say they’re considering it now or within the next 1-3 years), it marks a decline from previous years. About a quarter (27%) said they have no plans to move – the highest share recorded.
| Moving Consideration | 2018 | 2019 | 2020 | 2021 | 2022 | 2023 | 2024 |
| No plans to move | 20% | 20% | 19% | 17% | 15% | 15% | 27% |
| Might consider moving, but not within next 3 years | 12% | 14% | 12% | 14% | 12% | 12% | 15% |
| Considering moving in the next 2-3 years | 22% | 20% | 23% | 24% | 19% | 19% | 17% |
| Considering moving in the next year | 22% | 23% | 26% | 21% | 31% | 29% | 23% |
| Currently considering moving | 24% | 24% | 20% | 24% | 19% | 25% | 18% |
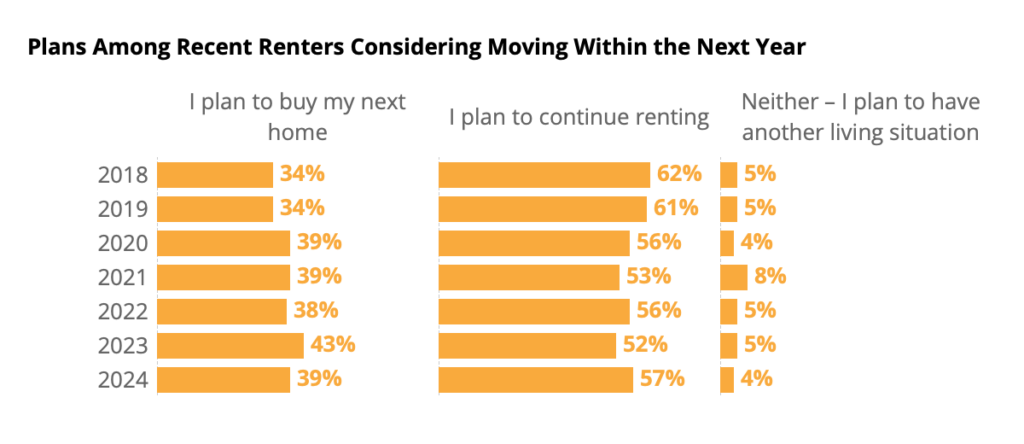
Among recent renters who intend to move within the next year, the share that say they plan to buy their next home fell to 39% in 2024, from 43% in 2023 – similar to 38% in 2022, 39% in 2021 & 2020, and slightly above 34% in 2018 and 2019.
| Among Recent Renters Considering Moving Within the Next Year | 2018 | 2019 | 2020 | 2021 | 2022 | 2023 | 2024 |
| I plan to continue renting | 62% | 61% | 56% | 53% | 56% | 52% | 57% |
| I plan to buy my next home | 34% | 34% | 39% | 39% | 38% | 43% | 39% |
| Neither – I plan to have another living situation | 5% | 5% | 4% | 8% | 5% | 5% | 4% |
Just over a third (37%) of renters say that they would be very or extremely likely to buy a home if rates fell, versus only one in eight (13%) who say the same if rates rise. If rates continue to rise, according to renters, then most say they are not very or not at all likely to buy their next home (69%), compared to only 37% who say the same if rates fell.
The 37% of renters who say falling rates would make them very or extremely likely to buy their next home represents a decline from last year, when 45% said the same.
About two thirds of renters (69%) say they are considering moving in the next three years, or might consider moving but are not sure when. For this group, about half (56%) say they intend to save up enough for a down payment or to buy a home outright. Smaller shares say they intend to save up for a large purchase (26%) like a car, computer or vacation. Only one in ten (11%) said they intend to pair up with a spouse or partner before their next move.
The typical recent renter surveyed in 2024 reported taking only one in-person tour. Going on at least two in-person tours is still quite common, however: 45% of recent renters reported taking at least two. Only about one in five (19%) recent renters forewent in-person tours entirely.
| Share of Recent Renters that Reported Taking | 2018 | 2019 | 2020 | 2021 | 2022 | 2023 | 2024 |
| 0 In-Person Tours | 21% | 19% | 18% | 23% | 23% | 19% | 19% |
| 1-4 In-Person Tours | 62% | 63% | 67% | 68% | 71% | 74% | 73% |
| 5 or More In-Person Tours | 16% | 17% | 15% | 10% | 6% | 8% | 9% |
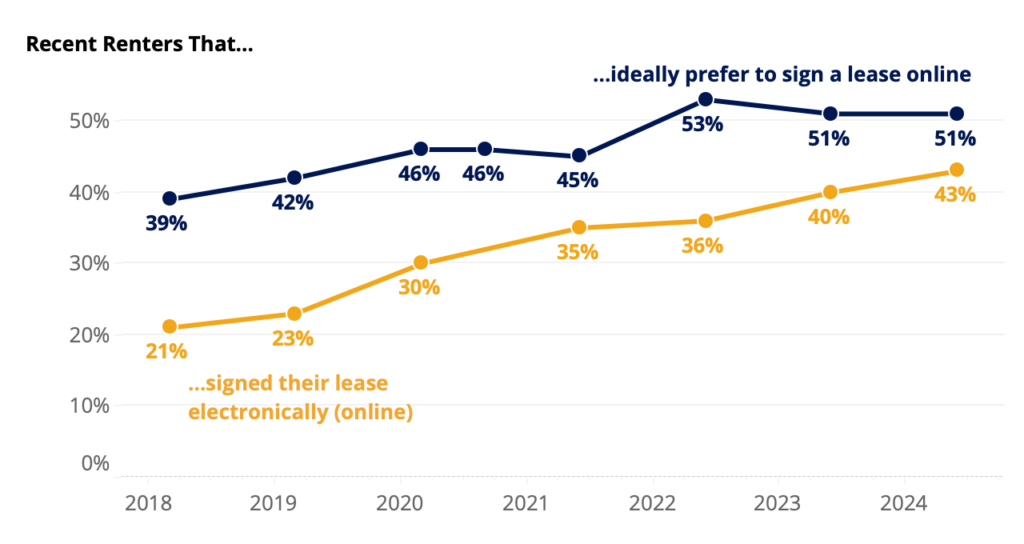
While the share of recent renters that signed their lease electronically stayed largely unchanged between 2018 and 2019 (21% and 23% respectively), 2020 saw a substantial increase to 30%, and the trend continued in 2021, when 35% of recent renters reported signing their leases electronically. In 2022, 36% of recent renters reported signing electronically – similar to 2021. 2023 saw that number increase to 40% and then 43% in 2024. In-person leases are still the norm for a slim majority of recent renters (51%), but have been on a downward trend.
| Recent Renters who signed their lease… | 2018 | 2019 | 2020 | 2021 | 2022 | 2023 | 2024 |
| In-person (on paper) | 72% | 72% | 66% | 56% | 55% | 52% | 51% |
| Electronically (online) | 21% | 23% | 30% | 35% | 36% | 40% | 43% |
| We did not sign the lease | 7% | 5% | 5% | 9% | 8% | 8% | 7% |
About half (51%) of recent renters said they signed their lease on paper. The same share (51%) said they would ideally prefer to sign a lease electronically.
Despite landlords and property managers stepping up their offering of electronic leasing options, the gap between the share of recent renters that signed online (43%) and would ideally prefer to sign online (51%) persits in 2024. However, this gap has shrunk significantly, from a 17-point gap in 2022 to a 8-point one in 2024.
| Ideally prefer to do each online | Spring 2018 | Spring 2019 | Spring 2020 | Fall 2020 | Spring & Summer 2021 | Spring & Summer 2022 | Spring & Summer 2023 | Spring & Summer 2024 |
| Apply for a rental | 59% | 58% | 58% | 65% | 60% | 65% | 67% | 67% |
| Sign a Lease | 39% | 42% | 46% | 46% | 45% | 53% | 51% | 51% |
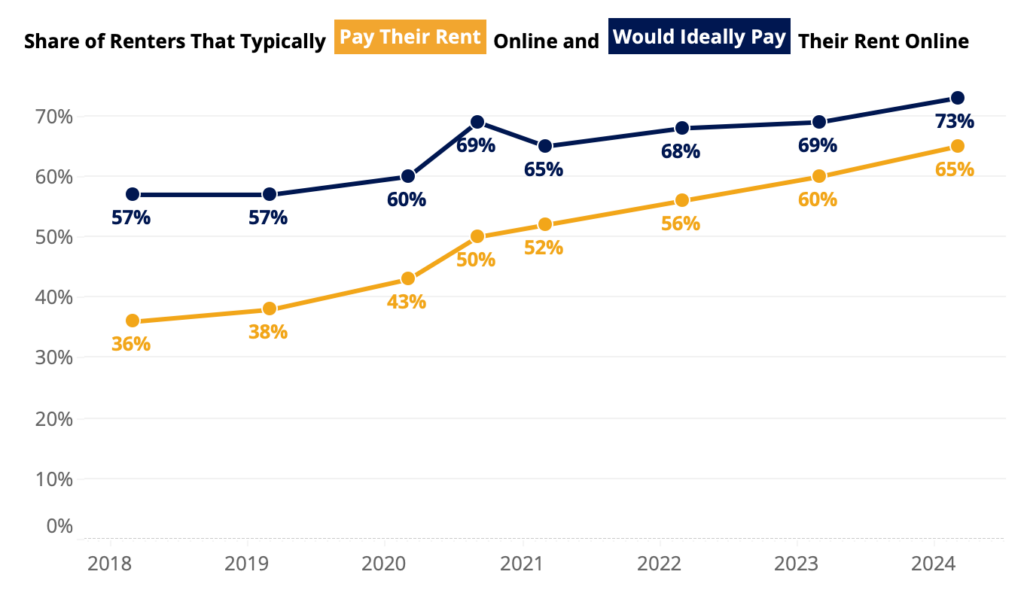
In fall of 2020, half (50%) of recent renters said they typically paid their rent online. Since then, the share has risen 15 points to 65%. Almost three quarters (73%) of recent renters say they would ideally pay their rent online.
| Typically pay their rent… | Spring 2018 | Spring 2019 | Spring 2020 | Fall 2020 | Spring & Summer 2021 | Spring & Summer 2022 | Spring & Summer 2023 | Spring & Summer 2024 |
| In person | 49% | 48% | 43% | 41% | 38% | 37% | 34% | 29% |
| Online | 36% | 38% | 43% | 50% | 52% | 56% | 60% | 65% |
| Through the mail | 9% | 8% | 9% | 7% | 6% | 4% | 4% | 2% |
| Other | 6% | 6% | 5% | 3% | 3% | 3% | 3% | 3% |
| Would ideally pay their rent… | Spring 2018 | Spring 2019 | Spring 2020 | Fall 2020 | Spring & Summer 2021 | Spring & Summer 2022 | Spring & Summer 2023 | Spring & Summer 2024 |
| In person | 28% | 28% | 24% | 20% | 28% | 28% | 27% | 24% |
| Online | 57% | 57% | 60% | 69% | 65% | 68% | 69% | 73% |
| Through the mail | 7% | 7% | 7% | 6% | 5% | 2% | 2% | 2% |
| Other | 8% | 8% | 9% | 5% | 2% | 1% | 1% | 2% |
| Gap Between Share of Renters that Typically and Would Ideally Pay Rent Online (in percentage points) | |||||||
| Spring 2018 | Spring 2019 | Spring 2020 | Fall 2020 | Spring & Summer 2021 | Spring & Summer 2022 | Spring & Summer 2023 | Spring & Summer 2024 |
| 21 points | 20 pts | 17 pts | 19 pts | 13 pts | 12 pts | 10 pts | 8 pts |
About a quarter (24%) of renters say that their lease allows them to leave with no more than a month of notice. For recent renters, the share is smaller: 14% of those that moved in the past year say their lease allows them to leave with no more than a month of notice.
Among renters on a fixed-term lease, almost two-thirds (64%) said they signed on for a 12-month duration. About one in four (24%) said their lease is longer than a year. Approximately one in eight (12%) said their lease is 2 years or longer, and one in seven (13%) say their lease is shorter than 12 months.
Renters were most likely to report moving into their rental in March (10%), April (10%), May (10%) and June (10%). They were least likely to report moving in December (5%) or November (6%).
| Among all renters, share that reported moving in | |
| January | 8% |
| February | 9% |
| March | 10% |
| April | 10% |
| May | 10% |
| June | 10% |
| July | 8% |
| August | 9% |
| September | 8% |
| October | 8% |
| November | 6% |
| December | 5% |
To gain a comprehensive understanding of US renters, Zillow Group Population Science conducted six nationally representative surveys – each sampling at least 6,500 renter-respondents. In total, the surveys contain information from over 36,000 unique renters – more than 8,100 recent renters and 27,900 tenured renters. Participants were allowed to take more than one survey. The study was fielded between March and July 2024.
For the purpose of this study, “renters” refers to household decision makers 18 years of age or older who rent their primary residence. “Recent renters” refer to those that moved in the past year, and “tenured renters” refer to those who did not move in the past year.
Results from this survey are nationally representative of renter households. US adult decision makers who live in a rented home were identified from online nonprobability samples. To achieve representativeness, we used a combination of quota sampling and statistical raking using benchmarks estimated from the 2022 American Community Survey (ACS) and the 2023 Current Population Survey Annual and Economic Supplement (CPS ASEC).
To reduce response bias, survey respondents did not know that Zillow Group was conducting the survey. Several additional quality control measures were also taken to ensure data accuracy:
Unless otherwise specified, estimates in this report come from the Consumer Housing Trends Report (CHTR) 2024, and year-over-year comparisons also use data from CHTR 2018, CHTR 2019 CHTR 2020, CHTR 2021, CHTR 2022, CHTR 2023, and supplemental renter surveys. To provide a fuller picture of the state of home rentals and renters’ characteristics, preferences and behaviors, we also analyzed data from other sources:
