Executive Summary
A global pandemic, historic economic change and an unprecedented shift in the housing market have been hallmarks of the past year. But while these large-scale changes have shifted the landscape and have the potential to reshape sellers’ preferences over the longer term, many behaviors and attitudes remain the same.
The 2021 Consumer Housing Trends Report (CHTR) provides a snapshot of what housing consumers are thinking and doing in mid-2021. In this report, we take a deeper look at sellers (household decision makers that moved in the past year and sold their previous primary residence); In other reports, we examine homeowners, renters, and buyers more closely.
Who are sellers?
The typical US seller is 45 years old, with about a quarter (24%) aged 60 or older. Most are partnered, married or previously married, have at least some college education, and are most likely to sell a home in the South. Demographic change tends to play out over a long time: Most of these characteristics have not changed substantially, if at all, over the last few years. About two thirds of sellers (65%) also reported buying a home.
What do their homes look like?
Most sellers (70%) sold a single-family detached house — however, other home types like a townhouse/rowhouse (11% of sellers said they sold one of these home types) or condo/co-op (9%) appear to have become more common among sellers surveyed in 2021. The typical seller’s previous home had three bedrooms, two bathrooms and was 1,536 square feet. The average seller reported living in their home for 14 years prior to selling.
What prompted sellers to move?
Overall, 79% of sellers say that a life event influenced their decision to move and sell their home: Almost half (46%) cited a change in their household or family size as a reason for moving, followed by a new job or job transfer (36%) and working remotely more often (35%). Financial circumstances also play a part: About two in five of sellers said low mortgage interest rates influenced their decision to sell (40%) — and slightly more (45%) sellers that also bought cited low mortgage interest rates as an influence.
Survey Methodology
Research Approach
In order to gain a comprehensive understanding of U.S. sellers, Zillow Group Population Science conducted a nationally representative survey of more than 2,000 sellers. The study was fielded between March and September 2021. Wherever possible, survey questions from previous years were asked in the same manner this year to allow for the measurement of year-to-year trends in key areas of interest. This year was the first year that ZG Population Science designed, fielded and analyzed the survey entirely in-house.
For the purpose of this study, “sellers” refers to household decision makers 18 years of age or older who moved and sold their previous primary residence within the past year.
Sampling & Weighting
Results from this survey are nationally representative of sellers. To achieve representativeness, ZG Population Science used a two-prong approach. First, the initial recruitment to the sample was balanced to all sellers from the U.S. Census Bureau, 2019 American Housing Survey (AHS) on the basis of age, relationship status, income, ethnicity/race, education, region and sex. Additional targeted subgroups were sampled based on all key household demographic characteristics. Second, statistical raking was used to create calibration weights to ensure that the distribution of survey respondents matched the U.S. population with respect to a number of key demographic characteristics.
Quality Control
To reduce response bias, survey respondents did not know that Zillow Group was conducting the survey. Several additional quality control measures were also taken to ensure data accuracy:
- We identified and terminated any professional respondents, robots or those taking the survey on multiple devices.
- Completion times were recorded to ensure that surveys submitted by the fastest respondents, who may have rushed through the survey, did not provide poor quality data. If necessary, these respondents were removed from the sample.
- In-survey quality control checks identified illogical or unrealistic responses.
Additional Data Sources
Unless otherwise specified, estimates in this report come from the Consumer Housing Trends Report (CHTR) 2021, and year-over-year comparisons also use data from CHTR 2018, CHTR 2019 and CHTR 2020. To provide a fuller picture of the state of home rentals and buyers’ characteristics, preferences and behaviors, we also analyzed data from other sources:
- U.S. Census Bureau, 2019 American Community Survey – The most recently available dataset from the U.S. Census Bureau’s survey of the U.S. population. The ACS is the nation’s largest survey and is based on a probability sample; as such, it is considered one of the leading sources of information on U.S. population and housing.
- U.S. Census Bureau, 2019 American Housing Survey – The most recently available dataset from the U.S. Census Bureau’s housing survey. The AHS includes housing details absent from the ACS, such as whether movers owned their previous home, their reasons for moving, and other detailed housing characteristics.
The Typical Seller & Home Sold
In this section, we provide a high-level overview of key seller info and what the homes they sold looked like. According to the most recent Census Bureau American Housing Survey (AHS) data available, 4% of households in the country have recently sold. Throughout this section, information about sellers comes from CHTR, and information about other groups comes from ZG Population Science analyses using ACS and AHS data.
Age
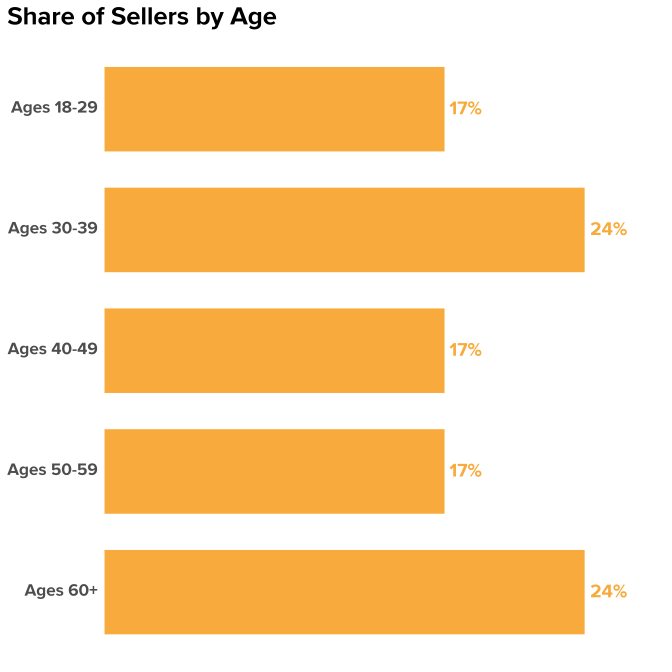
The median age of U.S. sellers is 45. About one in five sellers (17%) are in their twenties or younger, while roughly a quarter (24%) are in their sixties or older. In other words, the age distribution of sellers represents somewhat of a middle ground when it comes to U.S. housing consumers: They are typically younger than tenured homeowners (with a median age of 56) who have not moved in the past year, but older than renters (age 33). In regard to age, sellers are more similar to buyers (age 43) than tenured homeowners.
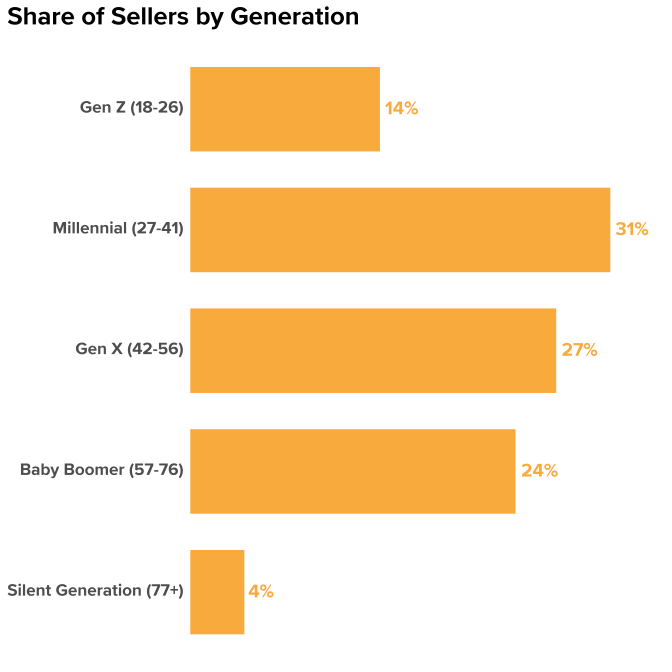
When looking by generation, Millennials constitute the largest share of sellers (31%). Similarly, millennials are also the largest group of buyers (37%).
Race & Ethnicity
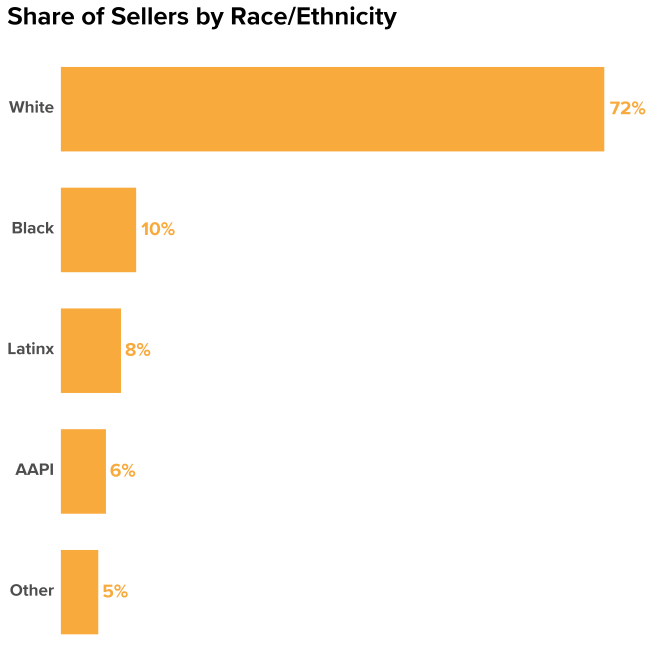
Almost three quarters of sellers are non-Hispanic white or Caucasian (72%), higher than the overall share of the U.S. adult population that is white (63%).
Region
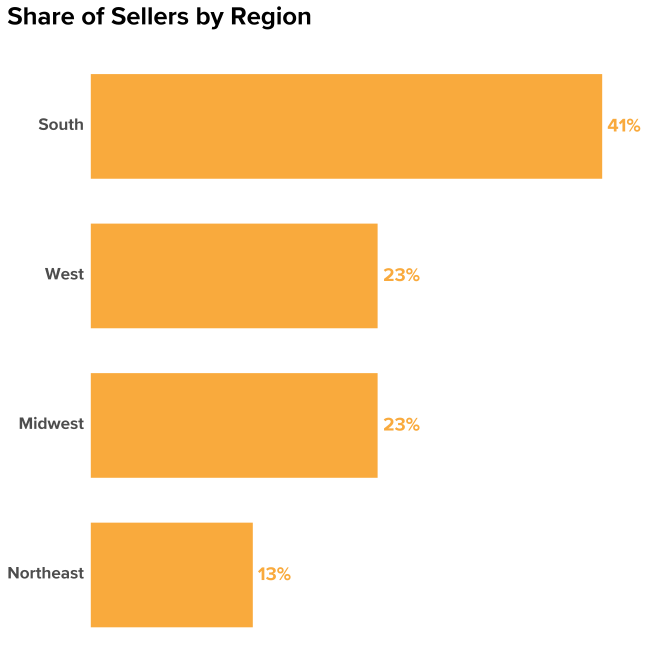
The largest share of sellers live in the South (41%), followed by the West (23%) and Midwest (23%). The smallest share lives in the Northeast (13%). Sellers largely follow the distribution of US adults, with a slightly higher concentration in the South and Midwest — likely because these regions have more for-sale inventory.
Gender Identity & Sexual Orientation

The percentage of sellers identifying as LGBTQ+ has been relatively stable over the last few years. About one in ten (10%) sellers identified as LGBTQ+ in 2019, the first year CHTR asked about sexual orientation and gender identity, then 14% in 2020 (not significantly different from 13% in 2021). The increase from 2019 represents the growing share of sellers who may be more likely to feel comfortable self-identifying as LGBTQ+.
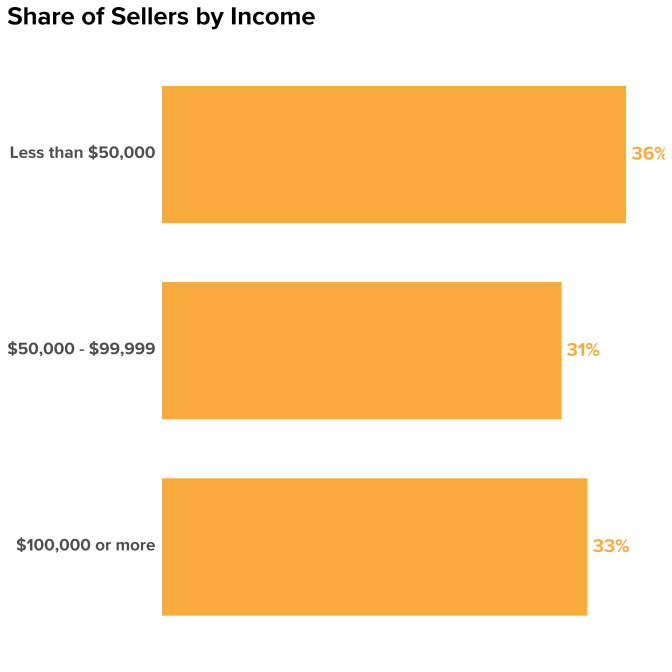
Income
Sellers tend to have similar household incomes to the U.S. population overall. The annual median household income among sellers is approximately $70,000, compared to the overall national median (2019) of $65,700.
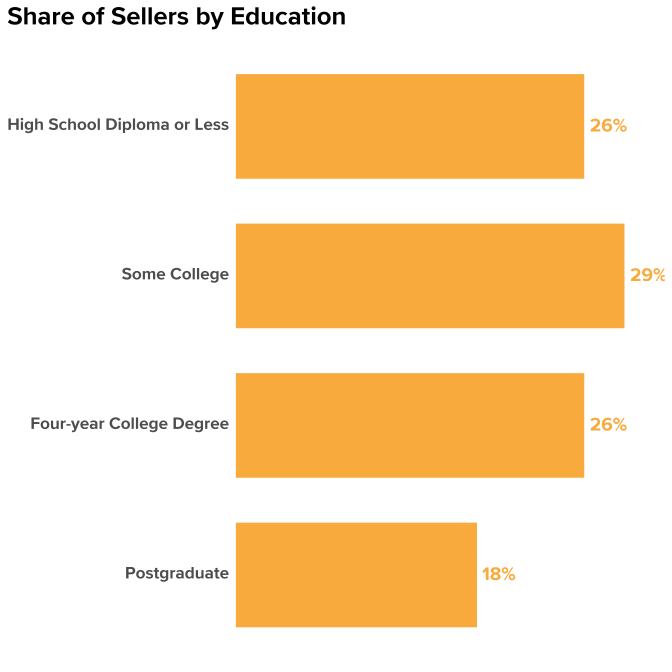
Education
Sellers tend to be more educated than the overall population of U.S. household decision makers: 44% of sellers have at least a four-year degree, higher than 34% of overall U.S. household decision makers.
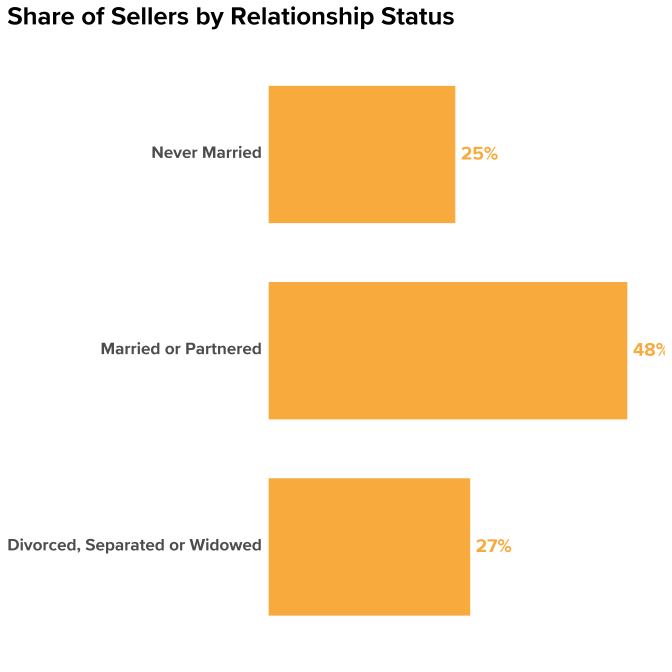
Relationship Status
Prior research has shown that the sale and purchase of a home is often tied to family formation or other life events, like a divorce or separation. This relationship between homeownership and family formation helps explain why most sellers are either currently married/partnered (48%) or have been married in the past (27%).
Household Composition
- 32% of sellers have children under age 18 in their homes
- 66% have at least one dog
- 35% have at least one cat
- 31% have another kind of pet
Urbanicity
About half of sellers (51%) describe the area where they sold as suburban; 34% say they sold a home in an urban area, and the remaining 15% say they sold in a rural area.
Home Type, Beds, Baths, and Size
The typical (median) seller sold a 3-bed, 2-bath, 1,536-square-foot single-family detached house. While a majority of sellers across urban, suburban and rural areas reported selling a single-family detached house, there was a significant increase from prior years in the share of sellers that sold another home type, including a townhouse (11%, up from 9% in 2020) or condo/co-op (9%, up from 6% in 2020). This finding is consistent with buyers, who may have gravitated toward many of these more-affordable and/or relatively more-available home types as an option that fit their budget.
Most Sellers Also Buy
About Two Thirds of Sellers Also Buy A Home
About two in every three sellers (65%) report buying a home in addition to selling one. Just over half of these dual seller-buyers upgrade — buying a larger home than the one they sold (58%) and/or one that’s more expensive (55%).
Seller-Buyers that Upgrade Skew Younger and Higher Income
The typical seller-buyer that upgrades to a more expensive home is 43 years old, similar to 42 for seller-buyers that upgrade to a larger home (with more square feet). The median household income for these upgrading seller-buyers is around $97,500 (for seller-buyers that upgrade to a more expensive home, or $87,500 for those that upsize to a larger one). Contrastingly, the median age of a seller-buyer that buys a less expensive home is 50 years old (and 55 for those that downsize to a smaller home) and their typical household income is around $62,500 (or around $57,500 for downsizers).
Downsizers Less Likely to Have Children At Home, More Likely to be Retired
Upsizers are about 73% more likely to report having at least one child under age 18 at home than downsizers. Downsizers are also more than twice as likely to be retired (35% of seller-buyers that downsize report being retired, compared to 14% of upsizers). Most upsizing sellers (68%) report working full time.
Despite a Hot & Competitive Market, Most Seller Experiences were Similar to Past Years
Number of Offers
Consistent with the past three years, the typical seller got two offers — but a notable share received many more than that. Almost a quarter (24%) of sellers reported getting four offers or more offers this year, up from 14% in 2020.
| Number of Offers |
2018 |
2019 |
2020 |
2021 |
| 0 |
11% |
14% |
12% |
9% |
| 1 |
36% |
36% |
37% |
31% |
| 2 |
23% |
22% |
23% |
20% |
| 3 |
14% |
12% |
13% |
16% |
| 4 or more |
15% |
17% |
14% |
24% |
| Median (typical) |
2 |
2 |
2 |
2 |
Offers that Fell Through
The share of sellers that reported having an offer fall through remained stable in 2021 as well: The typical seller reported having zero offers fall though.
| Number of Offers that Fell Through |
2018 |
2019 |
2020 |
2021 |
| 0 |
59% |
60% |
58% |
56% |
| 1 |
24% |
21% |
21% |
21% |
| 2 |
8% |
9% |
10% |
11% |
| 3 |
4% |
3% |
4% |
6% |
| 4 or more |
5% |
8% |
7% |
7% |
| Median (typical) |
0 |
0 |
0 |
0 |
Cash Offers
Most sellers (74%) said that at least one of the offers they received was all cash or did not include a financing contingency. This is consistent with 77% of agents reporting that they sometimes submitted an all-cash offer on behalf of their clients. The fact that more than two thirds (68%) of buyers purchased with a mortgage, though, suggests that buyers that finance with a mortgage can still compete with cash offers — assuming their offer is sufficiently appealing in other ways. Perhaps not surprisingly, sellers generally value money and time when selling their home. When asked about their top consideration when selling their home, most have consistently ranked maximizing profit as their top priority (51% of sellers considered this their top priority when asked in 2020). Second to profit, sellers have been most likely to rank selling within their target timeframe a top priority (37% said it’s their top consideration). Taken together, these pieces of information suggest that a cash offer can still fail if a seller feels that the offer is too low or risks delaying the sale (insufficient earnest money or the offer being contingent on the sale of the buyer’s home, for example).
Inspections
Most sellers (65%) said they received at least one offer that waived an inspection. However, 88% of successful buyers said they got an inspection prior to finalizing their home purchase. A similar share of sellers (84%) reported that a potential seller completed an inspection on the home at least once. The discrepancy between offers that waive inspections and the share of buyers that complete one suggests that waiving inspection contingencies is not a surefire way to win against other offers. Much like competing with cash, buyers that insist on an inspection can still generally win if their offer is adequately appealing to a seller’s desire for profit and undelayed timeline.
| Share of Sellers that Reported |
2018 |
2019 |
2020 |
2021 |
| 0 Inspections completed by a potential buyer |
19% |
21% |
19% |
16% |
| 1-3 Inspections |
73% |
71% |
72% |
73% |
| 4 or More Inspections |
8% |
8% |
9% |
12% |
| Median number of inspections |
1 |
1 |
1 |
1 |
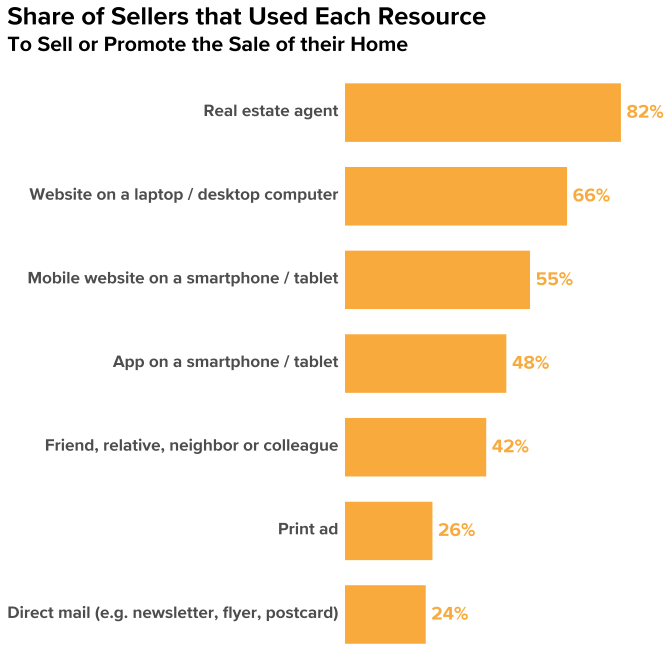
Sellers Continue to Stick with Agents
Rising digital options like remote viewings, 3D tours, and instant offers appear to complement the services that real estate agents offer, not replace them. The share of sellers that use a real estate agent has remained unchanged over the last three years. When it comes to resources they use to sell their home, sellers are more likely to use a real estate agent (82%) than a website on a computer (66%), mobile website (55%), app (48%), friend/relative/neighbor/colleague (42%), print ad (26%) or direct mail (24%).
Among sellers that also bought a home, 62% of those that work with an agent to sell use the same agent to buy. Younger sellers that also buy are even more likely to stick with the same agent: 67% of those in their 20s or younger do, as do 70% in their 30s, 73% of those in their 40s, and 63% of those in their 50s. For seller-buyers over age 60, though, dual agency starts to drop: only 41% of those in their 60s and 44% of those in their 70s or older said they employed the same agent to buy and sell.
| Among seller-buyers that use an agent |
All Ages |
Ages 18-29 |
Ages 30-39 |
Ages 40-49 |
Ages 50-59 |
Ages 60-69 |
Ages 70+ |
| Same agent to sell and buy |
62% |
67% |
70% |
73% |
63% |
41% |
44% |
| Different agent to sell and buy |
31% |
31% |
26% |
23% |
29% |
47% |
40% |
| Used an agent to sell, but no agent to buy |
7% |
2% |
4% |
4% |
8% |
12% |
16% |
Selling Activities
Slight Decrease in Share of Sellers that Have an Open House
The typical seller still has only one open house, but the share that forego open houses entirely increased among those surveyed in 2021: 43% said they had none, compared to 39% in 2020.
| Share of Sellers that Reported Having |
2018 |
2019 |
2020 |
2021 |
| 0 Open Houses |
37% |
38% |
39% |
43% |
| 1-3 Open Houses |
49% |
44% |
45% |
44% |
| 4 or More Open Houses |
14% |
16% |
16% |
13% |
| Median number of open houses |
1 |
1 |
1 |
1 |
Most sellers report leaving their home at least once for a private showing or open house (68%). However, in 2021 sellers were less likely to report doing so four times or more (27% in 2021 compared to 32% in 2020).
| Share of Sellers that Reported Leaving Their Home for a Private Showing or Open House |
2019 |
2020 |
2021 |
| 0 times |
30% |
28% |
32% |
| 1-3 times |
39% |
40% |
42% |
| 4 times or more |
31% |
32% |
27% |
| Median |
2 |
2 |
1 |
Taking Home Off the Market is Atypical, Often Associated with Selling Below List
Almost three quarters of sellers (72%) never take their home off the market until it is sold. Sellers that report temporarily taking their home off the market at least once are more likely to end up selling below their original list price. About a third (30%) of sellers that sell below their original list price report temporarily taking their home off the market at least once, compared to 23% of those that sell for the exact price they listed.
| Share of Sellers that Reported temporarily taking their home off the market |
2018 |
2019 |
2020 |
2021 |
| 0 times |
71% |
71% |
66% |
72% |
| 1-3 times |
25% |
23% |
26% |
23% |
| 4 times or more |
4% |
6% |
8% |
5% |
| Median |
0 |
0 |
0 |
0 |
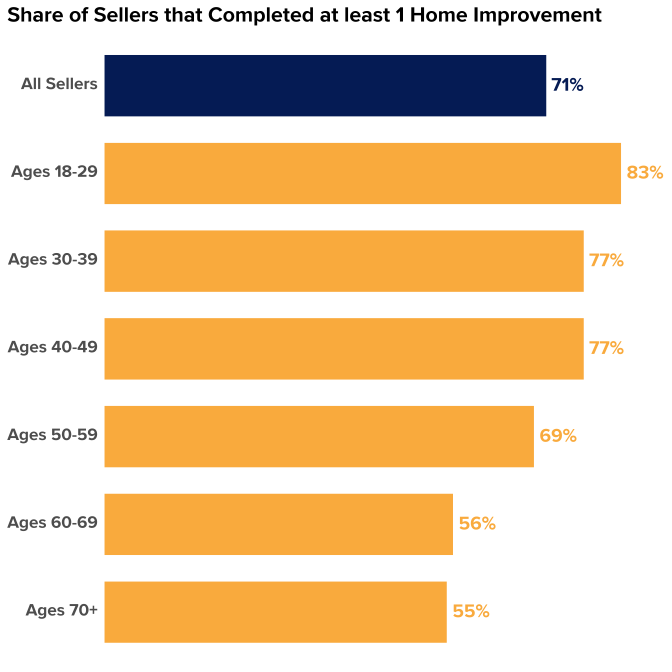
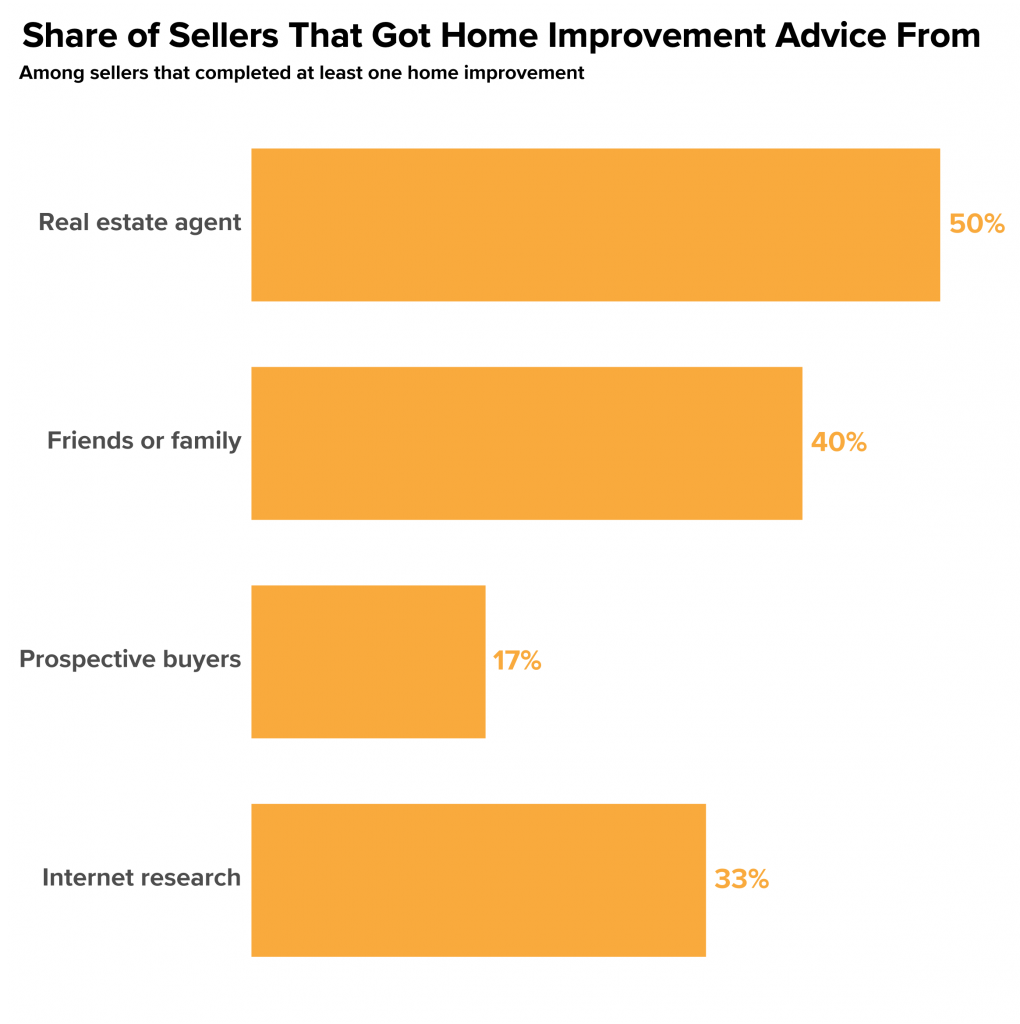
Most Sellers Complete At Least Home Home Improvement
Most sellers (71%) said they completed at least one improvement project as part of selling their home (e.g. painting, redecorating, kitchen improvement, new appliances, replacing/repairing flooring, etc). Among these home-improving sellers, 87% got advice on which improvements to complete. Agents were the most common source of improvement advice; 50% of sellers that completed at least one home improvement said their agent gave them help or advice when deciding which improvements to complete. Friends or family (40%) followed, then internet research (33%). Less than one in five (17%) of home-improving sellers said they got help or advice from prospective buyers.

Younger sellers are more likely to report completing at least one home improvement: 83% of sellers in their 20s or younger say they completed at least one, as did 77% of sellers in their 30s, 77% in their 40s, and 69% in their 50s. Closer to half of sellers in their 60s (56%) and 70s or older (55%) say they completed such an improvement.

