July 2020 Market Report and Zillow Weekly Market Report Through August 15
The typical home price rose to $253,527 this July, propelled upward by rock-bottom inventory tallies that continue to plumb new depths.
The typical home price rose to $253,527 this July, propelled upward by rock-bottom inventory tallies that continue to plumb new depths.
The typical home price rose to $253,527 this July, propelled upward by rock-bottom inventory tallies that continue to plumb new depths, contrary to typical seasonal patterns that see inventory peak in late summer. Year-over-year, prices grew 4.5% — the fastest pace since May 2019. Month-over-month home value growth jumped from 0.4% in June to 0.48% in July, the quickest acceleration since May 2012. The count of homes on the market is now down 28% from this time last year, and may dip below 1 million homes for the first time in Zillow’s data.
All summer, listings have gone pending — the first step to a sale — at a rate higher than similar weeks in 2019. Pending sales on Zillow surpassed year-ago levels in the week ending June 6, the first time that had been the case since the week ending March 28 –when the full effect of the coronavirus pandemic had become evident nationwide and caused sales activity to slow. During that 10-week slowdown, there were 22% fewer pending sales than in the same 10 weeks of 2019. Since June 6, however, pending sales have outpaced 2019 volumes by about 11%.
On the supply side of the market, this year’s shortfall is stunning. Starting on March 26, we saw fewer listings appear on Zillow than the same date a year ago, and levels have still not recovered. Cumulatively, Zillow saw just over 3 million new listings in those nearly five months of 2019, compared with about 2.5 million new listings this year. That shortfall alone goes a long way toward explaining why we now see about 400,000 fewer listings than this time last year.
Buyers this summer have taken advantage of record-low mortgage rates, recently dipping below 3%. Those mortgage rates help buyers lock in savings for years to come: a typical home bought with 20% down at today’s rates requires monthly principal and interest payments of $851. Even though the typical American home was about $11,000 cheaper ($242,509) last summer, the higher interest rates at the time meant that the monthly payment of principal and interest, $882, was about 3.6% higher.
Demographics are also buoying demand. The large Millennial generation is entering their 30s en masse, approaching the median age at which Americans tend to buy their first home: 34. There are approximately 5 million more Americans aged 26-35 than there were 10 years ago. For those young households who still have their jobs and savings, they may view today’s low-rate environment as an opportunity to lock in an affordable mortgage payment for years to come, giving them space to start a family.
While demand has largely recovered to slightly above normal levels, the most abnormal thing about this summer is the lack of supply. Many sellers may be holding back due to a prevailing belief that now is not a good time to sell. Fannie Mae’s National Housing Survey showed a steep decline in the number of respondents who think that now is a good time to sell, from a recent high of 67% in February to a low of 29% in March, followed by a partial recovery as far as 45% in July. The survey does not report reasons why people consider it a bad time to sell, but such reasons might include: memories of the last recession, when homes lingered on the market and struggled to attract offers; concern about the health risks of letting prospective buyers tour one’s home while listed; and perhaps concern about the difficulty of finding another home to move into in such a low-inventory environment.
Another likely factor behind missing listings is the wave of homeowners entering forbearance — an arrangement in which they can pause payments to their mortgage servicer without triggering foreclosure — thanks to a provision in the CARES Act. According to the latest report from the Mortgage Bankers Association, about 7.2% of active mortgages are currently in forbearance, or about 3.6 million households. While that reflects a modest decline from over 8.5% in forbearance earlier this summer, it is still a staggering number. For context, it is almost as many as the estimated 3.8 million total foreclosed homes in the entirety of the housing crash from 2007 to 2010.
It’s likely many of the borrowers currently in forbearance could not afford their payments, and would have either sold their homes in a hurry and potentially at a bargain price, or ultimately entered foreclosure and saw their homes sold by the bank. Both processes would have dramatically altered the housing market overall this summer. Even compared to how these homeowners in forbearance would have behaved in the absence of the pandemic or recession, it is likely that some fraction would have planned to sell their homes, either to “move up” to a nicer home or to move geographically, but now they are effectively stuck in place until they get their jobs back.
Finally, since we considered the demographics of first-time home buyers, it is worth considering whether people’s choices are changing at the other end of the age spectrum. It would not be surprising if some older homeowners who may have planned to sell their homes and move to retirement homes or assisted living facilities are delaying that move due to health concerns during the pandemic. In some sense this would be pushing back some of the listings expected as part of the “silver tsunami” expected from older Americans selling their homes.
Previous Zillow research found that this recession’s wave of layoffs disproportionately affected renters, and now the unemployed are having even more trouble paying their bills. The National Multifamily Housing Council’s rent payment tracker showed a two-percentage point increase in the share of renters who had not paid August rent as of August 13, compared to the same time in 2019. While many renters are currently covered by eviction moratoria, very few can expect rent forgiveness or extensions on the same scale, or structured similarly, to the forbearance policies that have protected homeowners. Consequently, many renters are moving out and looking for other shelter when unable to pay rent. Millions of young adults, predominantly 18-25 year-olds, moved back in with their parents or grandparents this spring. And as detailed above, many of the most financially secure renters in the Millennial generation are taking advantage of low mortgage rates to jump into homeownership.
Altogether, this amounts to demand for rentals slackening substantially this summer, which is now reflected in slowing rent growth. Nationwide, the Zillow Observed Rent Index increased only 1.2% from July 2019, and dropped by more than 2% year-over-year in each of the New York, San Francisco, and San Jose metropolitan areas.
For at least the next few months, it seems that the inventory crunch will keep putting upward pressure on prices. The shortage is so acute that even if new listings rebound to a normal flow in August, it would take months to bring the market back to a healthy, balanced level of inventory.
Over the next year or more, the outlook is less predictable. Many of today’s homeowners in forbearance may still be unable to pay their mortgages next spring, potentially bringing a flood of motivated sellers and foreclosures to market. Perhaps an effective, widely distributed vaccine will bring the pandemic to a swift end, so a rush of seniors list their homes as they catch up on plans to move out of homeownership.
On the other hand, an effective vaccine and robust economic recovery could boost consumer confidence and purchasing power, bringing yet more buyers to the market and encouraging existing homeowners to start trading up for more space or to move closer to family.
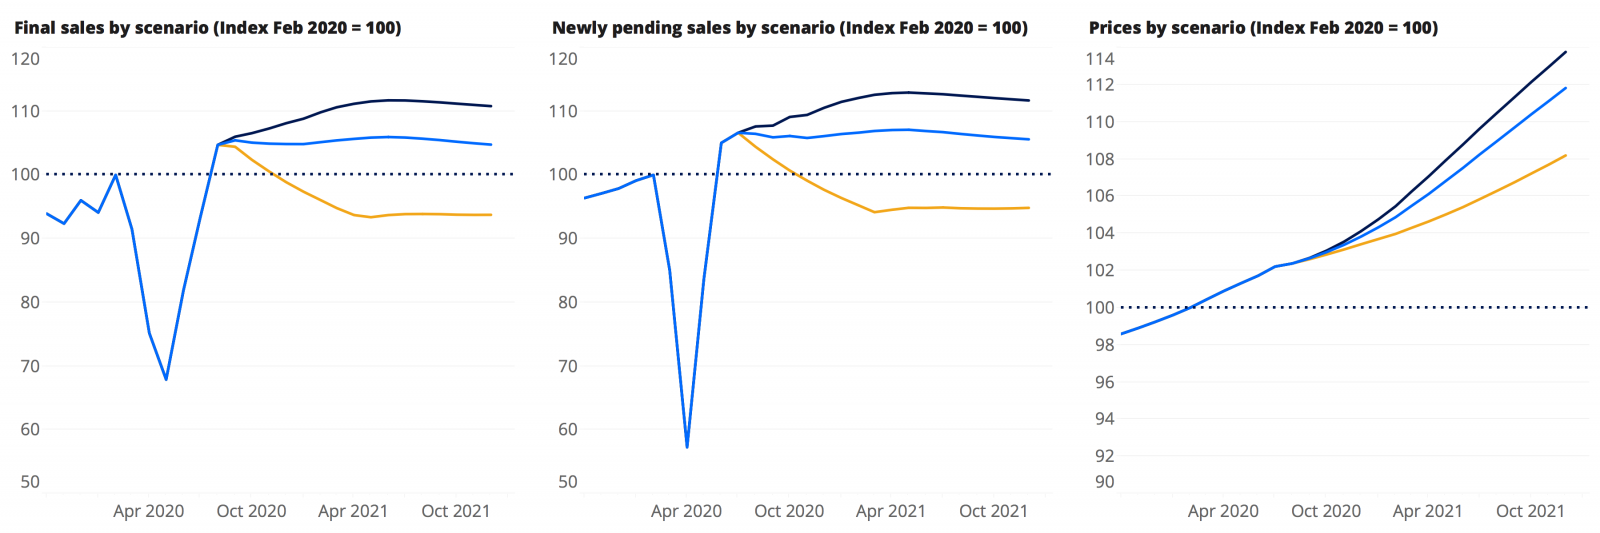
While we continue to think an economic recovery next year is most likely, supporting continued home value growth and rising home sales, we are incorporating the downside risks enumerated above in our pessimistic forecast scenario.
Zillow’s updated, probability-weighted forecast predicts that home value appreciation will slow to 3.6% over the next 12 months from the 4.5% year-over-year growth in July. In the short term, the updated forecast is now more optimistic toward continued home value growth than previous versions of the forecast, while the increased likelihood of the pessimistic scenario is reflected in the longer-term forecasted slowdown in home value appreciation.
From here, we expect a flat, slightly declining path for home sales through 2021, resulting in part from a persistent shortage of for-sale inventory. We expect seasonally adjusted newly pending sales to be 4% above pre-pandemic levels by the end of 2020.
In weekly data covering the week ending August 15, newly pending sales figures continued to grow. Sales figures from early July, the most recent data available, show a big jump from the previous week.
The Zillow Weekly Market Reports are a weekly overview of the national and local real estate markets. The reports are compiled by Zillow Economic Research and data is aggregated from public sources and listing data on Zillow.com. New for-sale listings data reflect daily counts using a smoothed, seven-day trailing average. Total for-sale listings, newly pending sales, days to pending and median list price data reflect weekly counts using a smoothed, four-week trailing average. National newly pending sales trends are based upon aggregation of the 38 largest metro areas where historic pending listing data coverage is most statistically reliable, and excludes some metros due to upstream data coverage issues. For more information, visit www.zillow.com/research/.
Click here to read past editions of Zillow’s Weekly Market Report.
