Zillow Weekly Market Report, Data Through Nov. 28
The housing market continues to show impressive strength heading into the traditionally slower winter months.
Year-over-year growth in list prices remained in the double digits the week of Thanksgiving as the housing market continues to show impressive strength heading into the traditionally slower winter months. Inventory suffered its biggest weekly drop since the new and monthly drops in a year, and the pace of homes going under contract slowed somewhat but remains well above levels from the same week a year ago.
Here are the key U.S. housing market stats for the week ending Nov. 28:
Double-Digit Annual Growth in List & Sale Prices
- Median list prices were up 12% from a year ago, to $338,675, as strong demand for homes persists. The median price of homes listed for sale began growing in January and peaked in mid-October before beginning to come back down — much later in the year than usual. In 2019, list prices peaked in mid-June.
- In the week ending Oct. 17 (the latest for which data is available) annual growth in median sale prices ticked down slightly from the prior week, but remained 13.1% higher than the same week in 2019. Among the nation’s 50 largest markets, annual growth in median sale price was highest in Memphis (22.8%), Kansas City (18.3%) and Boston (16.8%).
Inventory continues to dwindle
- Overall inventory was down 7% from last month, the largest monthly drop since January, and slipped 33.8% from the same time in 2019. The nation’s pool of homes for sale has largely fallen continuously year-over-year since August 2019, but huge demand in 2020 coupled with a notable amount of seller anxiety has brought levels to new lows.
- Among major markets, the largest annual drops in inventory were in Salt Lake City (-48.9%), Riverside (-48.2%), Baltimore (-46.1%) and Raleigh (-45.2%).
Pace of pending sales slows somewhat, but remains far faster than 2019
- Newly pending listings fell 6.2% from the prior week, the seventh weekly decline in a row and an indicator that sales volumes may finally be beginning to cool somewhat as autumn turns to winter. Even so, the number of homes that went under contract was up 14.2% from the same time last year.
- The typical time a listing stayed on market before going under agreement was steady at 13 days nationwide, suggesting that strong demand is still pushing buyers to move quickly. Houses went under contract 20 days faster than this time last year. Yearly decreases in days on market among major metros were largest in Virginia Beach (-36), Hartford (-32) and Cleveland (-29).
Home values expected to grow another 7.9% over the next 12 months
- This outlook is more optimistic than last month’s: In September, we expected a 7% increase in home prices through September 2021.
- In October, quarterly ZHVI growth was 2.6% — the strongest three-month growth recorded since 2005.
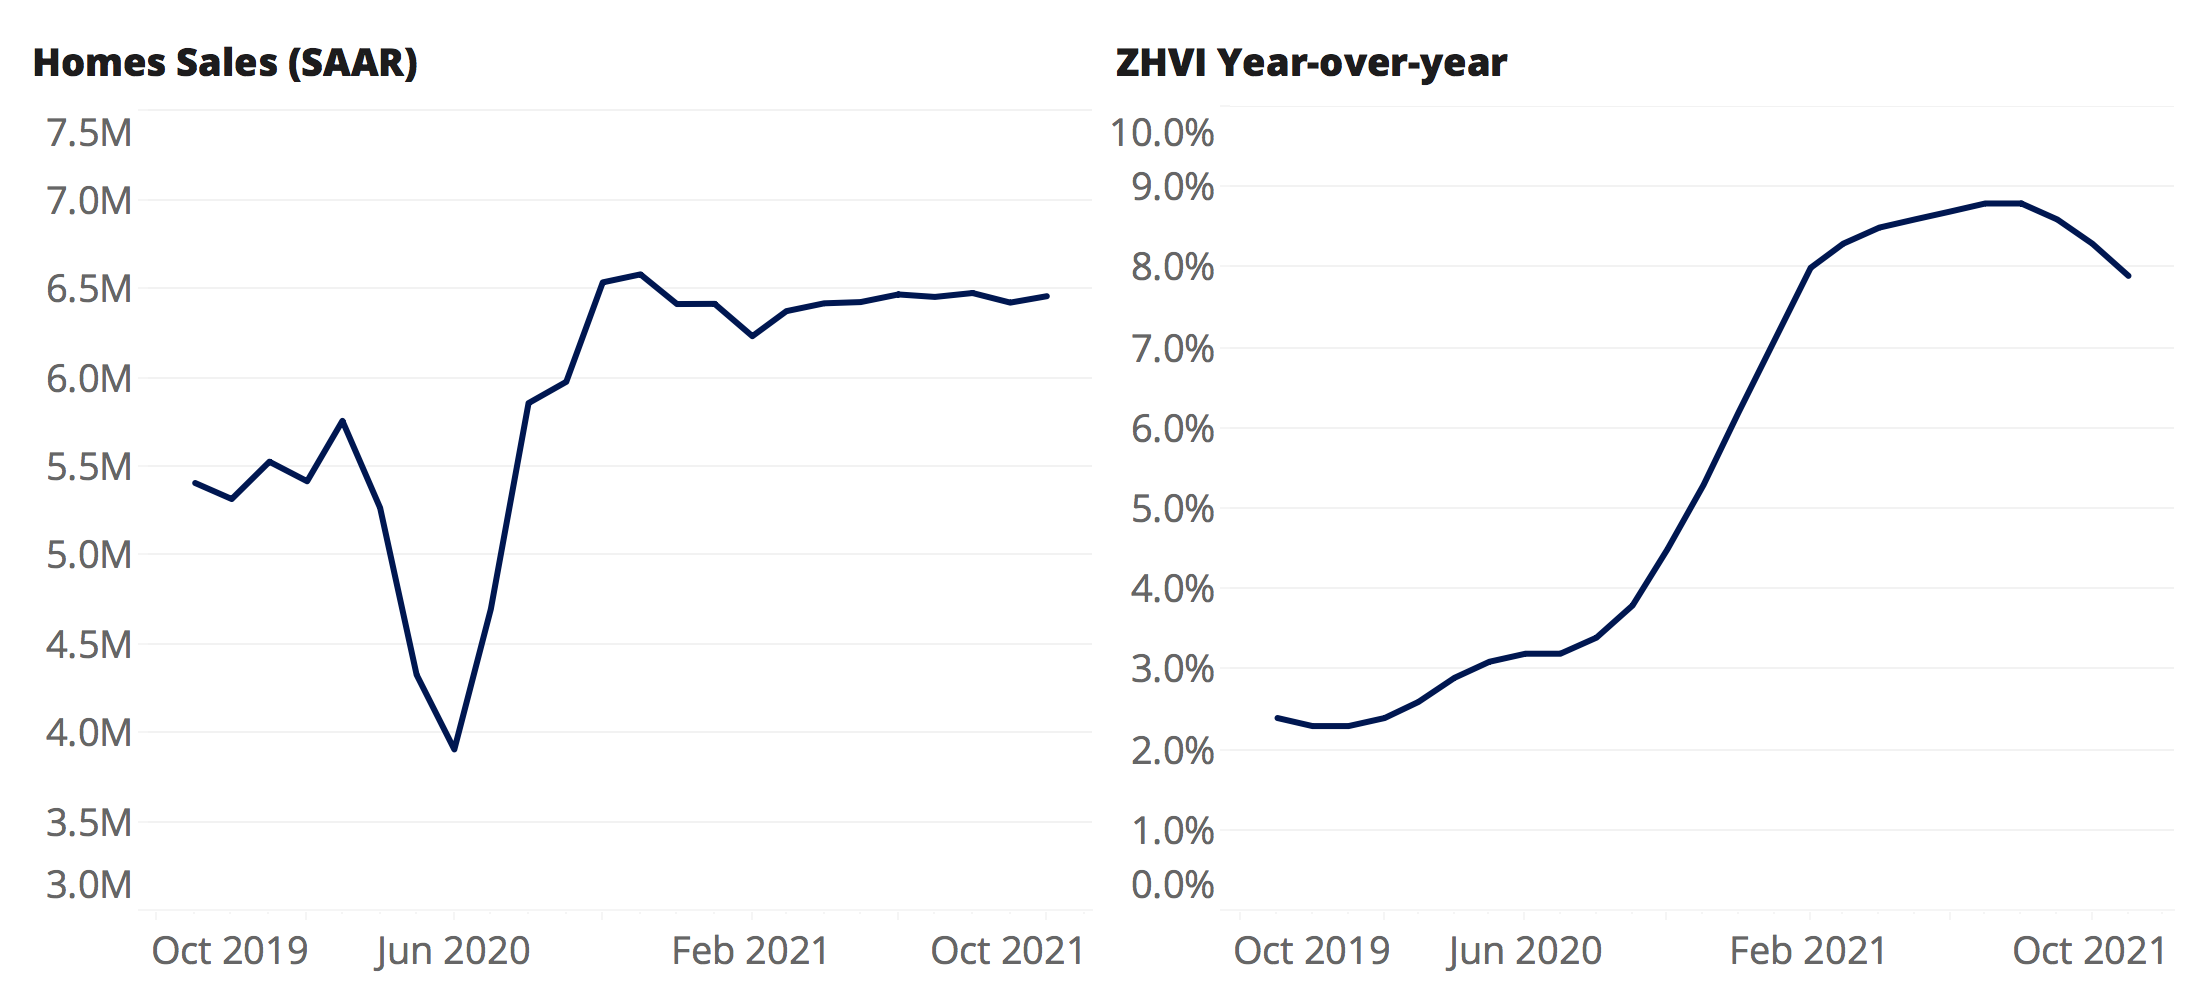
Home sales will remain near their current, elevated levels well into 2021
- In October, there were 6.85 million sales of existing homes (at a seasonally adjusted annualized rate — the number of homes that would sell in a year based on that month’s sales volume), up 26.6% from October 2019 and the strongest level since 2005.
- We expect this torrid pace to moderate slightly but remain elevated over the next year, averaging 6.42M through September 2021. That would mark the strongest 12-months for home sales since 2006.
Methodology
The Zillow Weekly Market Reports are a weekly overview of the national and local real estate markets. The reports are compiled by Zillow Economic Research and data is aggregated from public sources and listing data on Zillow.com. New for-sale listings data reflect daily counts using a smoothed, seven-day trailing average. Total for-sale listings, newly pending sales, days to pending and median list price data reflect weekly counts using a smoothed, four-week trailing average. National newly pending sales trends are based upon aggregation of the 38 largest metro areas where historic pending listing data coverage is most statistically reliable, and excludes some metros due to upstream data coverage issues. For more information, visit www.zillow.com/research/.
Click here to read past editions of Zillow’s Weekly Market Report.

