Zillow Weekly Market Report, Data Through Oct. 3
The frenetic pace of newly pending sales seems to finally be subsiding as the weather turns, but a dire lack of inventory is keeping sellers in control.
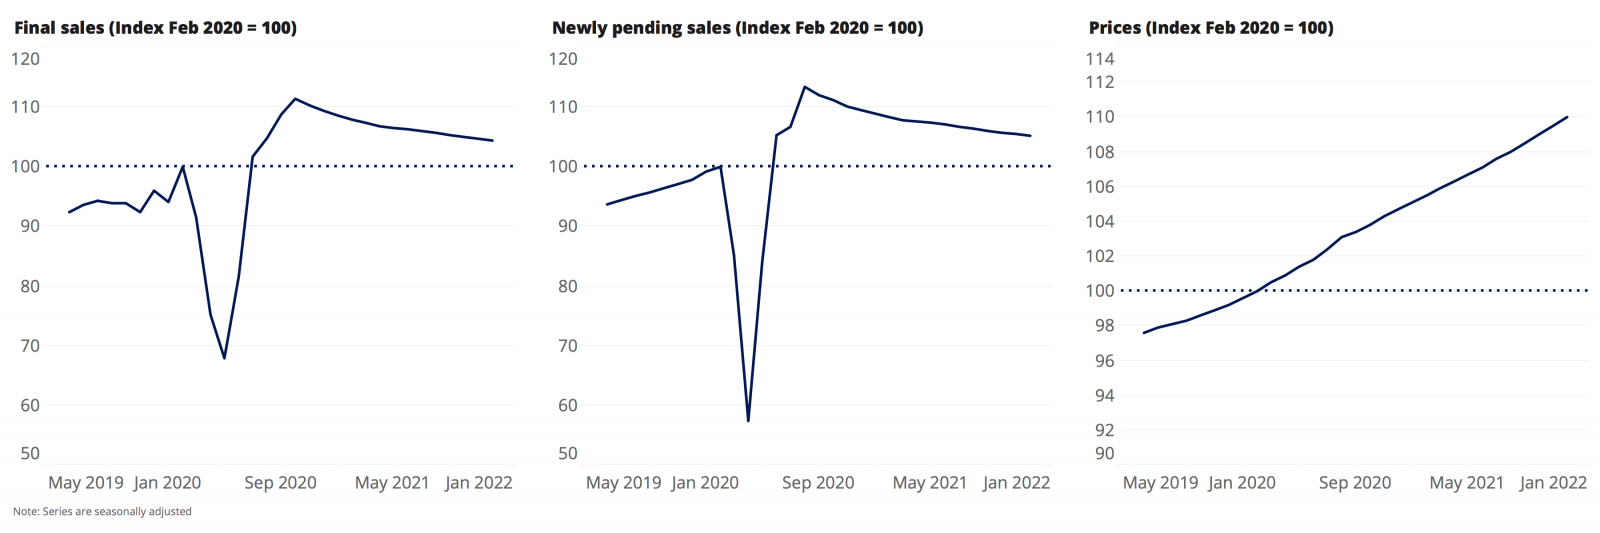
Home price momentum continued into early October, with annual median list price growth reaching double digits. Although the frenetic pace of newly pending sales seems to finally be subsiding as the weather turns, a dire lack of inventory is keeping sellers in control of the market.
Late seasonal slowdown continues as buying activity cools
- The home buying frenzy that took off in June and lasted through the summer continued to cool off, likely signalling the beginning of an anticipated but much-delayed seasonal slowdown. Newly pending listings were up 17.6% compared to the same week a year ago, but were down 2.2% from the previous week and 7.3% month-over-month.
- Time on the market stayed steady at 13 days, 15 days faster than the same week last year.
Inventory drops to record lows as sellers stay sidelined
- Demand for homes still far outpaces supply, as total inventory continued the long slide that began in late May. Total for-sale inventory fell 1.2% week-over-week, and is now 35.7% lower than last year, the largest annual decline since Zillow’s weekly data series began in 2019.
- Among the country’s 50 largest metro areas, inventory dropped the most from last year in Riverside (48%), Salt Lake City (47.3%) and Memphis (47%).
- Sellers seem content to watch the action from the sidelines: New for-sale inventory fell 0.6% over the week. As of Oct. 3, new inventory was down 18.1% year-over-year.
Prices maintain momentum to push high above last year’s levels
- Median list price rose slightly week-over-week, to $345,225, and was up 10.9% from last year — the largest year-over-year gain since at least 2019. List prices have grown rapidly since a 0.2% annual decline in early May, when the median was $317,228.
- Median sale price for the week ending August 22 ticked up 0.4% week-over-week to $285,843, 9.9% above last year’s prices and the largest year-over-year rise in prices in Zillow weekly data going back through 2019. At the same time last year, sale prices were up 4.2% over 2018.
Stimulus talks stumble, adding to long-term economic uncertainty
- Negotiations surrounding another comprehensive federal stimulus package fell apart earlier this week, likely prompting the Federal Reserve to take additional action to stimulate the economy, and in turn keeping mortgage rates low for the foreseeable future.
- More than half of the economists in a monthly survey by the Wall Street Journal said they didn’t expect job numbers to return to pre-pandemic levels until 2023 or later, citing a slower labor market recovery, potential for the crisis worsening, and the lack of a new stimulus plan.
Housing market outlook improves, but lingering economic uncertainty tempers expectations
- Sales expected to stay high but taper through 2021: Seasonally adjusted home sales are expected to peak this fall then gradually decline through 2021. Sales volumes overall are forecasted to remain higher than pre-pandemic levels throughout this year and next.
- Home price outlook adjusted higher for coming year: Seasonally adjusted home prices are expected to increase 1.2% from August to November and rise 4.8% between August 2020 and August 2021. The previous forecast predicted a 3.8% increase in home prices over this time frame.
- Here’s why: The forecasts for seasonally adjusted home prices and pending sales are more optimistic than previous forecasts because sales and prices have stayed strong through the summer months amid increasingly short inventory and high demand. The pandemic also pushed the buying season further back in the year, adding to recent sales. Future sources of economic uncertainty, including lapsed fiscal relief, the long-term fate of policies supporting the rental and mortgage market and virus-specific factors, were incorporated into this outlook.
Methodology
The Zillow Weekly Market Reports are a weekly overview of the national and local real estate markets. The reports are compiled by Zillow Economic Research and data is aggregated from public sources and listing data on Zillow.com. New for-sale listings data reflect daily counts using a smoothed, seven-day trailing average. Total for-sale listings, newly pending sales, days to pending and median list price data reflect weekly counts using a smoothed, four-week trailing average. National newly pending sales trends are based upon aggregation of the 38 largest metro areas where historic pending listing data coverage is most statistically reliable, and excludes some metros due to upstream data coverage issues. For more information, visit www.zillow.com/research/.
Click here to read past editions of Zillow’s Weekly Market Report.

