Zillow Weekly Market Report, Data Through Oct. 17
Inventory keeps hitting new lows, and prices keep getting higher. Pending sales are slowing after a hot few months.
As inventory keeps hitting new lows — down almost 50% year-over-year in some major markets — prices keep getting higher. But the lack of available homes and an overdue seasonal slowdown may finally be pulling pending sales down after a scorching past few months.
Time on market falls to just 12 days, but pending sales are slowing down
- Newly pending sales are up 19.6% over last year, but have fallen 4.9% since last month and 1.7% since last week. Low inventory and an overdue seasonal slowdown may finally be dragging down sales, though sales volume remains close to what would be expected during a typical spring shopping season.
- Demand for the few homes available is still incredibly strong, as homes typically stayed on the market for 12 days before going pending, 16 days faster than this time last year and one day faster than most weeks in August and September. Cincinnati has the shortest median time on market at 4 days.
- Entry-level and mid-market homes priced between $186,000-$344,000 are selling at the fastest pace among all price tiers.
Inventory freefall continues, now down almost 50% in some markets
- Total inventory has dropped every week since late May, and is now down 37% — or more than 500,000 homes — from last year, to a total of 863,234.
- Of the 50 largest U.S. markets, those with the least inventory compared to last year are Salt Lake City (-49.9%), Charlotte (-47.7%) and Riverside (-47%).
List and sale price hikes persist, but low mortgage rates bolster affordability
- Median list price rose to $346,259, up 11.7% — about $36,000 — year over year and 0.4% over last month. Annual list price growth at this time last year was 3.9%.
- Median sale price rose 10.9% ($28,000) from last year, to $287,750 for the week ending Sept. 5. Year-over-year sale price growth was 4.6% a year ago.
- Low mortgage rates are helping to keep buyers’ budgets manageable, even as prices quickly rise. If you purchased a home on Sept. 5 this year, at the prevailing median price and mortgage rate, your monthly payment would be just 4.4% higher, or $55 more per month, than if you had purchased a home at the price point and mortgage rate prevailing at the same time last year.¹
Construction Activity, Existing Sales Stay Strong in September
- Residential construction activity increased slightly in September and home starts are up 11.1% year over year. However, construction activity is below where we otherwise might expect, considering the extreme demand for houses and builder confidence.
- Sales of existing homes rose at their fastest annual pace since 2010 in September, according to the National Association of Realtors. Sales rose to 6.54 million (SAAR), up 9.4% from August and 20.9% from a year ago.
Home value growth expected to continue accelerating in coming months
- We expect seasonally adjusted home values to increase 2.9% between September and the end of 2020, and rise 7% in the 12 months ending September 2021. This forecast is notably more optimistic than previously: Our prior forecast called for a 4.8% rise between August 2020 to August 2021.
- Historically low levels of for-sale inventory teamed with robust buyer demand and mortgage rates that remain near historic lows should continue to place upward pressure on prices.
2020 home sales likely peaked in September, expected to reaccelerate early next year
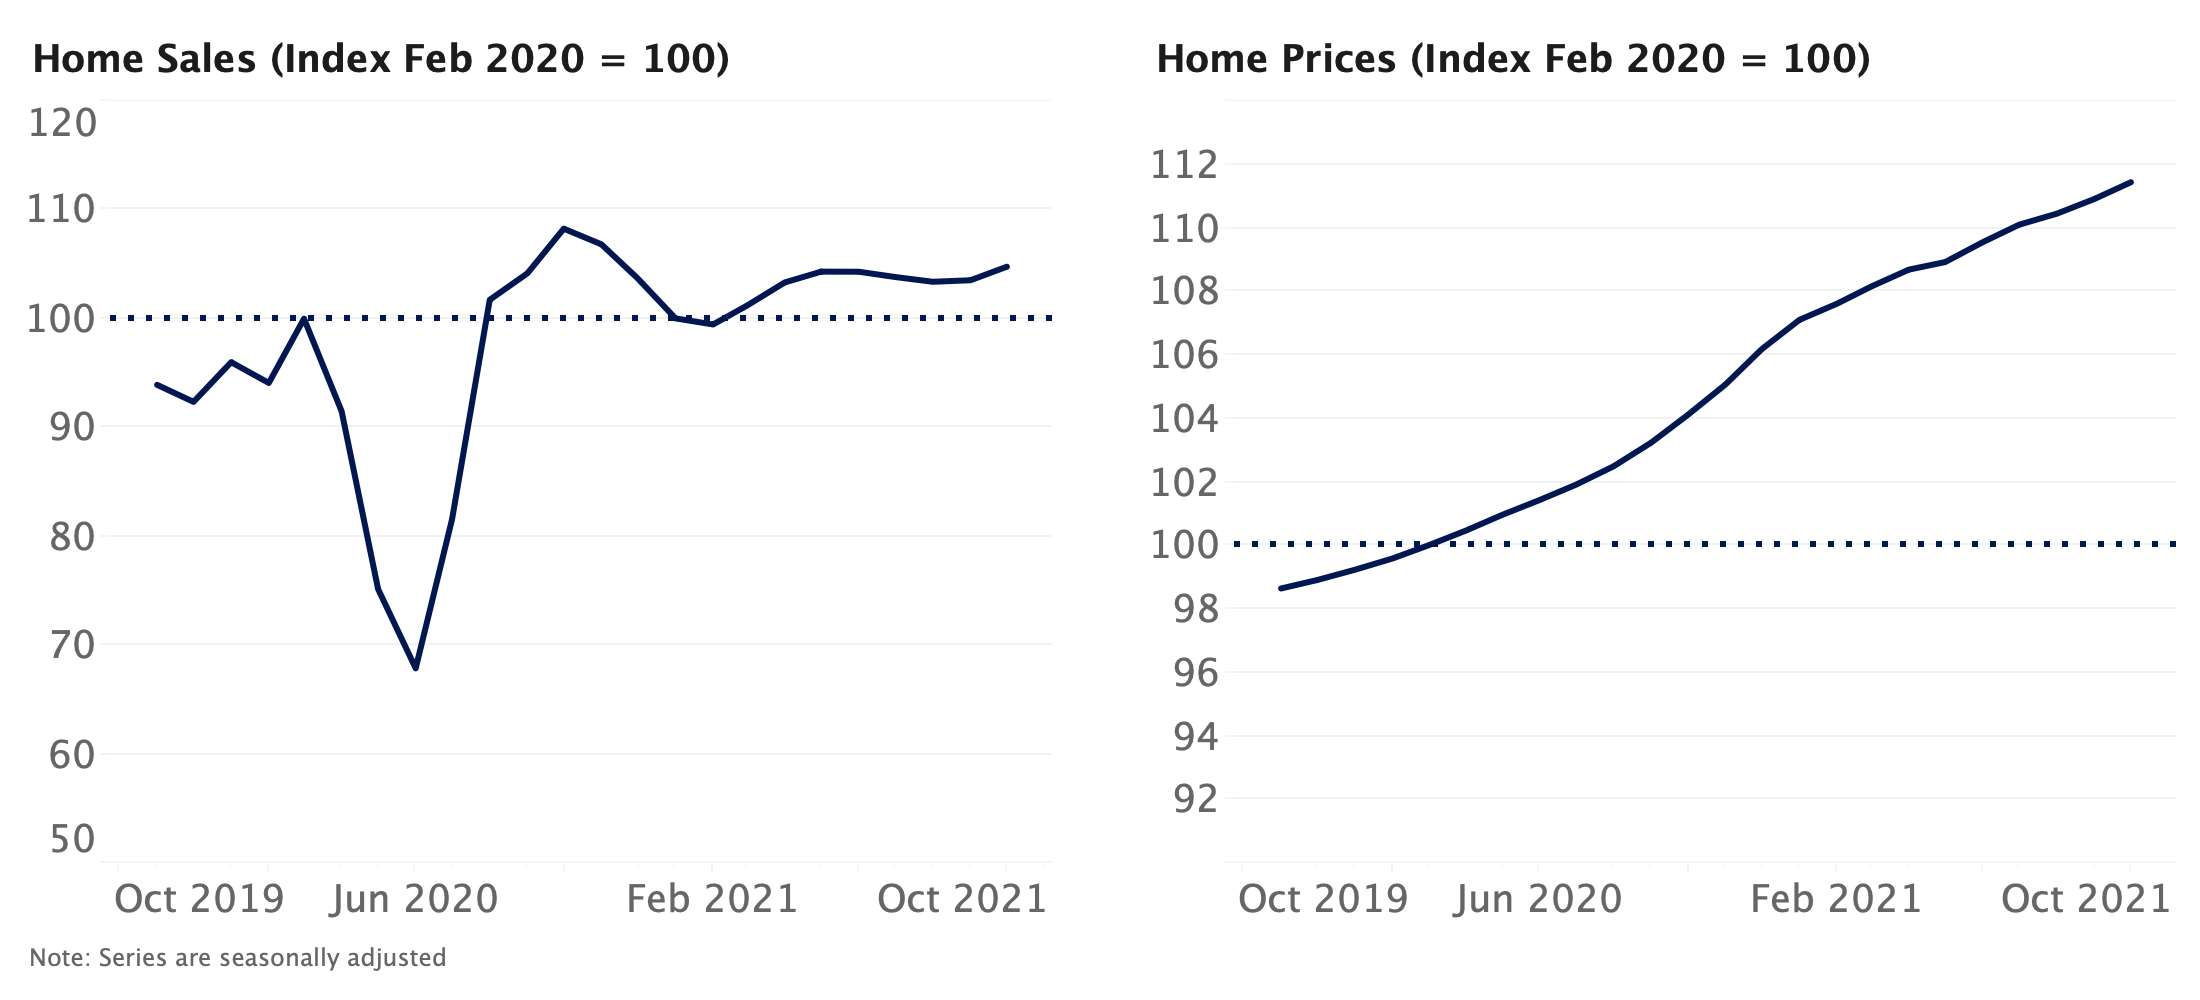
- Our forecast suggests that closed home sales reached a recent high in September, and will temporarily slow down in coming months, falling to pre-pandemic levels by January 2021. Growth is then expected to resume next spring and to remain firmly above pre-pandemic volume through most of next year.
- This short-term deceleration in sales volume can be attributed in large part to an expected slowdown in GDP growth, the fading impact of historically low mortgage rates, fewer sales occurring that were deferred from earlier this year and historically low levels of for-sale inventory. An expected reacceleration of GDP growth in 2021 should help push sales volumes higher.

¹Using the closest daily rates available from the Freddie Mac Primary Mortgage Market Survey. Monthly payments calculated with Zillow’s Mortgage Calculator using 20% down payment.
Methodology
The Zillow Weekly Market Reports are a weekly overview of the national and local real estate markets. The reports are compiled by Zillow Economic Research and data is aggregated from public sources and listing data on Zillow.com. New for-sale listings data reflect daily counts using a smoothed, seven-day trailing average. Total for-sale listings, newly pending sales, days to pending and median list price data reflect weekly counts using a smoothed, four-week trailing average. National newly pending sales trends are based upon aggregation of the 38 largest metro areas where historic pending listing data coverage is most statistically reliable, and excludes some metros due to upstream data coverage issues. For more information, visit www.zillow.com/research/.
Click here to read past editions of Zillow’s Weekly Market Report.

