$3,000
- 1 bd
- 1 ba
- 739 sqft
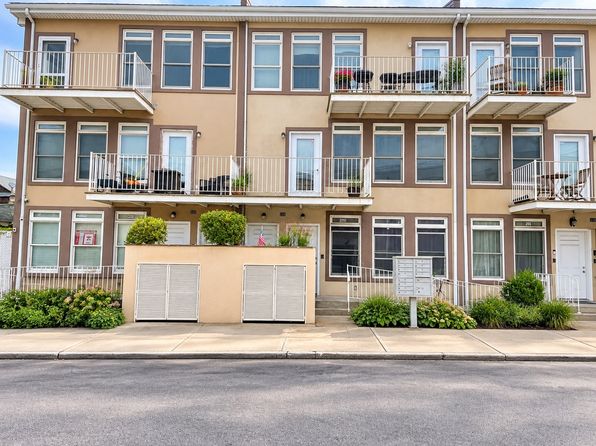
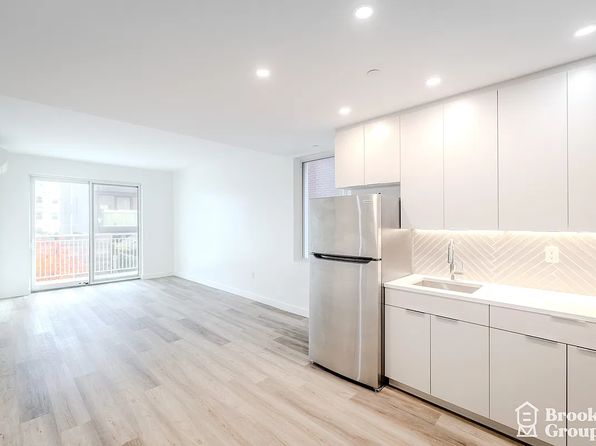
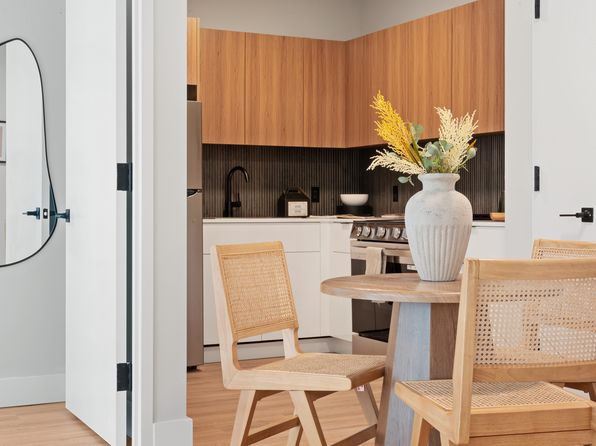
133 Beach 116th St #3L
The average Rockaway Park, NY home value is $559,207, down 0.1% over the past year. (Updated on )
Zillow Home Value Index (ZHVI), built from the ground up by measuring monthly changes in property level Zestimates, captures both the level and home values across a wide variety of geographies and housing types.
Typical Home Values: $559,207
1-Year Value Change: -0.1%
(Data through September 30, 2026)
Zillow is more than a place to browse homes. It’s a place to connect with a local agent, explore financing solutions, schedule home tours, understand your buying and selling power, and more.
The neighborhoods with the highest median home values in New York, NY include: Tribeca ($3,801,299), SoHo ($3,339,980), Cobble Hill ($2,157,586), Carroll Gardens ($2,047,318), Greenwich Village ($1,926,162).
The neighborhoods with the lowest median home values in New York, NY include: Bedford Park ($252,769), Parkchester ($257,867), Highbridge ($285,900), Concourse ($321,503), Kingsbridge ($321,800).
Neighborhoods with the highest year-over-year value growth in New York, NY include: Van Nest (16.6%), Baychester (13.9%), Belle Harbor (13.5%), Borough Park (13.2%), Neponsit (11.9%).