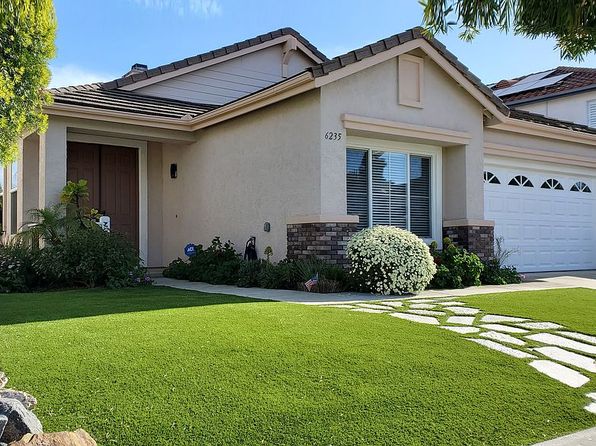
"Hollywood, Los Angeles" or "New York, NY"
- Views: 118,218
- US
-
California
Nearby States
- Alaska
- Alabama
- Arkansas
- American Samoa
- Arizona
- California
- Colorado
- Connecticut
- Washington D.C.
- Delaware
- Florida
- Georgia
- Guam
- Hawaii
- Iowa
- Idaho
- Illinois
- Indiana
- Kansas
- Kentucky
- Louisiana
- Massachusetts
- Maryland
- Maine
- Michigan
- Minnesota
- Missouri
- Northern Mariana Islands
- Mississippi
- Montana
- North Carolina
- North Dakota
- Nebraska
- New Hampshire
- New Jersey
- New Mexico
- Nevada
- New York
- Ohio
- Oklahoma
- Oregon
- Pennsylvania
- Puerto Rico
- Rhode Island
- South Carolina
- South Dakota
- Tennessee
- Texas
- Utah
- Virginia
- Virgin Islands
- Vermont
- Washington
- Wisconsin
- West Virginia
- Wyoming
-
San Diego
Nearby Cities
- Agua Dulce
- Alpine
- Bonita
- Bonsall
- Borrego Springs
- Bostonia
- Boulevard
- Camp Pendleton North
- Camp Pendleton South
- Campo
- Cardiff
- Carlsbad
- Casa De Oro-Mount Helix
- Chula Vista
- Coronado
- Crest
- Del Mar
- Descanso
- Dulzura
- El Cajon
- Encinitas
- Escondido
- Fairbanks Ranch
- Fallbrook
- Granite Hills
- Guatay
- Harbison Canyon
- Hidden Meadows
- Imperial Beach
- Jacumba
- Jamul
- Julian
- La Mesa
- La Presa
- Lake San Marcos
- Lakeside
- Lemon Grove
- Mount Laguna
- National City
- Oceanside
- Pala
- Palomar Mountain
- Pauma Valley
- Pine Valley
- Potrero
- Poway
- Rainbow
- Ramona
- Ranchita
- Rancho San Diego
- Rancho Santa Fe
- San Diego Country Estates
- San Diego
- San Marcos
- San Ysidro
- Santa Ysabel
- Santee
- Scripps Miramar Ranch
- Skyline Paradise Hills
- Solana Beach
- Southeastern San Diego
- Spring Valley
- Tecate
- Torrey Hills
- University
- Uptown
- Valley Center
- Vista
- Warner Springs
- Winter Gardens
-
Neighborhood
Nearby Neighborhoods
- Allied Gardens
- Alta Vista
- Balboa Park
- Bay Ho
- Bay Park
- Bay Terraces
- Bayside Village
- Bird Land
- Campland on the Bay Trailer Park
- Carmel Mountain
- Carmel Valley
- Chollas View
- City Heights East
- City Heights West
- Clairemont Mesa
- Clairemont
- College West
- Columbia
- Cortez Hill
- Darnall
- De Anza Trailer Harbor
- Del Cerro
- Del Mar Heights
- Del Mar Mesa
- East San Diego
- East Village
- Easter Cross
- Egger Highlands
- El Cerrito
- Elvira
- Emerald Hills
- Encanto
- Fiesta Shores
- Five Points
- Fleetridge
- Fort Rosecrans
- Fruitdale
- Gateway
- Grant Hill
- Grantville
- Jomacha/Lomita
- Kensington
- La Jolla Hermosa
- La Jolla Shores
- La Jolla Village
- La Jolla
- Lake Murray
- Linda Vista
- Little Italy
- Logan Heights
- Loma Portal
- Lomita
- Marina
- Midtown
- Mira Mesa
- Mission Bay Park
- Mission Bay Park
- Mission Valley
- Morena
- Mountain View
- Mt. Hope
- Nestor
- Normal Heights
- North City
- North Clairemont
- North Park
- Oak Park
- Ocean Beach
- Old Town San Diego
- Old Town
- Overlook
- Pacific Beach
- Palm City
- Paradise Hills
- Park West
- Rancho Bernardo
- Rancho Penasquitos
- Ridgeview/Webster
- Riviera Shores
- Roaring Creek
- Rolando
- Roseville / Fleet Ridge
- Sabre Springs
- San Carlos
- San Diego State University
- San Ysidro
- Scripps Ranch
- Serra Mesa
- Skyline
- Sorrento Valley
- Sorrento
- South Bay Terraces
- South Park
- South San Diego
- Southcrest
- Talmadge
- The Muirlands
- The Woods Trailer Park
- Tierrasanta
- University City
- University Heights
- Upper Providence
- Valencia Park
- Village Green Trailer Park
- Wooded Area
San Diego Home Prices and Home Values
-
Zillow Home Value Index
What's this? -
Median list price ($)
What's this? -
Median sale price ($)
What's this? -
Median days listed on Zillow
What's this? -
Homes for sale on Zillow
What's this? -
Total homes sold
What's this? -
Median value per sq. ft. ($)
What's this? -
Median list price per sq. ft. ($)
What's this? -
Median sale price per sq. ft. ($)
What's this? -
Median list-to-sale price ratio
What's this? -
Listings with price cut (%)
What's this? -
Median price cut (%)
What's this? -
Sold for loss (%)
What's this? -
Sold for gain (%)
What's this? -
Homes foreclosed (%)
What's this? -
Foreclosure re-sales (%)
What's this? -
Increasing values (%)
What's this? -
Decreasing values (%)
What's this? -
Sold in past year (%)
What's this?
- $381,000
- -2.3% Y-o-Y
- Calculated 11/02/2009*
|
RegionId
|
Region
|
M-o-M
|
Q-o-Q
|
Y-o-Y
|
Sep 2009
|
|---|---|---|---|---|---|
|
54296
|
0.9%
|
2.5%
|
-2.3%
|
381000
|
|
|
403231
|
1.1%
|
3.2%
|
-8.5%
|
362300
|
|
|
267997
|
0.3%
|
0.7%
|
-3.8%
|
365100
|
|
|
272758
|
-0.8%
|
-2.4%
|
-20.4%
|
224900
|
|
|
403243
|
-1.5%
|
-4.5%
|
-23.9%
|
204400
|
|
|
268012
|
|||||
|
276196
|
1.1%
|
3.6%
|
-2.0%
|
266900
|
|
|
268015
|
1.3%
|
3.7%
|
-6.1%
|
416400
|
|
|
113657
|
0.6%
|
1.7%
|
-6.2%
|
487100
|
|
|
272875
|
0.1%
|
0.1%
|
-15.7%
|
232800
|
|
|
272963
|
0.7%
|
2.1%
|
0.1%
|
349200
|
|
|
268024
|
0.4%
|
1.2%
|
-4.8%
|
867700
|
|
|
403244
|
1.2%
|
3.7%
|
5.6%
|
526700
|
|
|
273139
|
0.6%
|
1.9%
|
1.8%
|
508800
|
|
|
273140
|
0.5%
|
1.6%
|
0.8%
|
731300
|
|
|
403237
|
-1.7%
|
-5.1%
|
-22.7%
|
197300
|
|
|
403236
|
-1.2%
|
-3.5%
|
-16.5%
|
228300
|
|
|
403240
|
-1.5%
|
-4.7%
|
-21.5%
|
216500
|
|
|
268066
|
-1.0%
|
-3.3%
|
-22.4%
|
176300
|
|
|
268076
|
0.5%
|
1.5%
|
-3.2%
|
355500
|
|
|
403250
|
1.5%
|
4.6%
|
0.3%
|
411900
|
|
|
403232
|
2.3%
|
6.9%
|
-10.1%
|
172000
|
|
|
403230
|
0.4%
|
1.0%
|
-8.0%
|
322700
|
|
|
268082
|
0.7%
|
1.9%
|
-3.7%
|
401900
|
|
|
273349
|
1.4%
|
4.2%
|
2.0%
|
501400
|
|
|
403234
|
-1.6%
|
-4.8%
|
-15.8%
|
204600
|
|
|
273355
|
0.6%
|
1.9%
|
3.9%
|
355100
|
|
|
268104
|
0.6%
|
1.9%
|
-6.0%
|
248000
|
|
|
268106
|
-0.4%
|
-1.1%
|
-7.7%
|
532600
|
|
|
114649
|
0.1%
|
0.4%
|
6.6%
|
958500
|
|
|
273571
|
1.1%
|
3.0%
|
-3.7%
|
381900
|
|
|
273609
|
-1.1%
|
-3.4%
|
-19.2%
|
234300
|
|
|
268136
|
0.6%
|
1.9%
|
-6.7%
|
271200
|
|
|
268145
|
0.1%
|
-0.2%
|
-19.2%
|
197900
|
|
|
114961
|
-0.4%
|
-1.5%
|
-17.4%
|
222400
|
|
|
403245
|
-0.9%
|
-2.8%
|
-21.0%
|
236500
|
|
|
403238
|
-2.3%
|
-6.8%
|
-27.4%
|
177200
|
|
|
403239
|
-2.1%
|
-6.4%
|
-26.8%
|
172000
|
|
|
273808
|
2.8%
|
8.7%
|
9.6%
|
370900
|
|
|
268184
|
1.2%
|
3.6%
|
-3.6%
|
244700
|
|
|
268192
|
-1.3%
|
-3.7%
|
-16.9%
|
240100
|
|
|
115372
|
0.9%
|
2.7%
|
-4.9%
|
189000
|
|
|
268203
|
1.2%
|
3.0%
|
-9.7%
|
485000
|
|
|
115622
|
0.6%
|
1.6%
|
-4.1%
|
369200
|
|
|
268215
|
-4.7%
|
-13.3%
|
-25.1%
|
920700
|
|
|
403241
|
-1.8%
|
-5.4%
|
-19.8%
|
214500
|
|
|
274149
|
-0.7%
|
-2.4%
|
-16.7%
|
211600
|
|
|
274164
|
0.8%
|
2.2%
|
-0.3%
|
354900
|
|
|
274174
|
0.2%
|
0.6%
|
2.0%
|
629300
|
|
|
46087
|
0.5%
|
1.5%
|
-5.8%
|
1113900
|
|
|
268238
|
0.1%
|
0.3%
|
-1.6%
|
373700
|
|
|
116026
|
-0.5%
|
-1.8%
|
-9.2%
|
901200
|
|
|
268247
|
0.6%
|
1.6%
|
-9.6%
|
348700
|
|
|
268258
|
-1.7%
|
-5.4%
|
-29.5%
|
189200
|
|
|
116213
|
1.2%
|
3.6%
|
-0.5%
|
327000
|
|
|
268259
|
2.4%
|
7.4%
|
6.7%
|
347600
|
|
|
268287
|
-1.5%
|
-4.4%
|
-20.3%
|
215400
|
|
|
116266
|
1.0%
|
3.2%
|
-0.4%
|
675900
|
|
|
276439
|
0.1%
|
0.5%
|
-3.3%
|
595100
|
|
|
268297
|
1.4%
|
4.1%
|
-0.1%
|
564300
|
|
|
274527
|
1.8%
|
5.2%
|
1.7%
|
459300
|
|
|
116625
|
0.8%
|
2.5%
|
-1.9%
|
350000
|
|
|
268304
|
0.7%
|
2.2%
|
1.6%
|
617200
|
|
|
274553
|
-0.1%
|
-0.7%
|
-11.4%
|
528900
|
|
|
116638
|
0.6%
|
1.7%
|
-4.6%
|
721700
|
|
|
116647
|
-1.0%
|
-2.8%
|
-2.7%
|
775700
|
|
|
403251
|
-0.6%
|
-2.0%
|
-13.1%
|
318100
|
|
|
268312
|
-0.4%
|
-1.5%
|
-8.7%
|
250500
|
|
|
274588
|
1.5%
|
4.5%
|
0.5%
|
330300
|
|
|
274612
|
-2.8%
|
-8.3%
|
-33.1%
|
170200
|
|
|
274622
|
-2.9%
|
-8.3%
|
-28.0%
|
177100
|
|
|
116856
|
-0.1%
|
-0.4%
|
-15.5%
|
236200
|
|
|
116914
|
0.6%
|
1.7%
|
-8.0%
|
244500
|
|
|
274698
|
0.0%
|
-0.0%
|
-9.1%
|
1024800
|
|
|
116921
|
0.5%
|
1.3%
|
-5.1%
|
371600
|
|
|
274717
|
0.7%
|
2.1%
|
-1.1%
|
345400
|
|
|
274836
|
0.1%
|
0.2%
|
-11.5%
|
215300
|
|
|
117021
|
0.3%
|
0.7%
|
-8.3%
|
496000
|
|
|
403254
|
1.5%
|
4.5%
|
-1.1%
|
371800
|
|
|
274893
|
-0.2%
|
-0.6%
|
-4.7%
|
410800
|
|
|
268380
|
2.2%
|
6.7%
|
1.7%
|
386100
|
|
|
403253
|
-0.8%
|
-2.6%
|
-19.9%
|
222200
|
|
|
117156
|
0.4%
|
1.2%
|
-4.4%
|
564300
|
|
|
117174
|
-1.0%
|
-3.0%
|
-18.0%
|
237000
|
|
|
268390
|
-0.4%
|
-1.4%
|
-18.6%
|
225100
|
|
|
268393
|
0.6%
|
1.4%
|
-6.8%
|
459200
|
|
|
268410
|
0.8%
|
2.3%
|
-8.6%
|
456500
|
|
|
275127
|
0.7%
|
2.0%
|
-3.7%
|
399700
|
|
|
403248
|
-0.4%
|
-0.9%
|
2.1%
|
979900
|
|
|
117557
|
0.4%
|
1.3%
|
-2.1%
|
511800
|
|
|
276640
|
-0.0%
|
-0.3%
|
-11.6%
|
236300
|
|
|
268443
|
1.2%
|
3.7%
|
1.3%
|
332100
|
|
|
117770
|
-0.2%
|
-0.4%
|
0.0%
|
829400
|
|
|
117804
|
0.8%
|
2.5%
|
0.7%
|
434000
|
|
|
275284
|
0.6%
|
1.6%
|
-4.1%
|
430300
|
|
|
117883
|
|||||
|
117892
|
-0.2%
|
-0.7%
|
-18.6%
|
222900
|
|
|
117980
|
0.5%
|
1.5%
|
-1.6%
|
527400
|
|
|
118015
|
0.6%
|
1.8%
|
-1.8%
|
366000
|
|
|
268468
|
-4.0%
|
-11.1%
|
-34.4%
|
171700
|
|
|
268470
|
-0.9%
|
-2.6%
|
-14.1%
|
298500
|
|
|
275386
|
-0.8%
|
-2.5%
|
-16.1%
|
218300
|
|
|
275401
|
1.6%
|
5.1%
|
7.5%
|
607300
|
|
|
118211
|
0.8%
|
2.5%
|
2.8%
|
438900
|
|
|
268495
|
-3.4%
|
-9.8%
|
-35.3%
|
174400
|
|
|
403246
|
-3.1%
|
-8.6%
|
-26.6%
|
210000
|
|
|
118387
|
-0.5%
|
-1.6%
|
-8.7%
|
956200
|
|
|
403242
|
-1.8%
|
-5.4%
|
-25.8%
|
178300
|
|
|
268516
|
0.7%
|
2.0%
|
-5.6%
|
402200
|
|
|
403233
|
0.0%
|
0.1%
|
-11.4%
|
181800
|
|
|
403235
|
-0.1%
|
-0.2%
|
-13.6%
|
210200
|
|
|
118541
|
0.3%
|
0.9%
|
-0.5%
|
469000
|
|
|
268522
|
|||||
|
268525
|
0.7%
|
2.1%
|
2.3%
|
705500
|
|
|
268527
|
0.7%
|
2.3%
|
-4.8%
|
1215300
|
|
|
403249
|
|||||
|
118673
|
0.7%
|
2.0%
|
-2.5%
|
435800
|
|
|
275997
|
0.9%
|
2.6%
|
0.7%
|
342200
|
|
|
275840
|
-0.8%
|
-2.6%
|
-21.5%
|
204000
|
|
|
276122
|
-0.8%
|
-2.3%
|
-8.3%
|
868200
|
You've selected too many neighborhoods for comparison.
You can select up to 4 neighborhoods to compare. You must uncheck one or more neighborhoods before adding new neighborhoods.
To sort all selected neighborhoods to the top of the list, click the checkbox column header.