According to the first quarter Zillow Negative Equity Report, the national negative equity rate continued to decline to 18.8 percent, down 12.6 percentage points from its 31.4 percent peak in the first quarter of 2012. Negative equity has fallen for eight consecutive quarters as home values have risen. The national negative equity rate fell from 25.4 percent in the first quarter of 2013 and 19.4 percent in the fourth quarter, while the pace of annual home value growth slowed to 5.7 percent in the first quarter of 2014, from 6.6 percent at the end of the fourth quarter of 2013. However, more than 9.7 million homeowners with a mortgage still remain underwater (Figure 1).

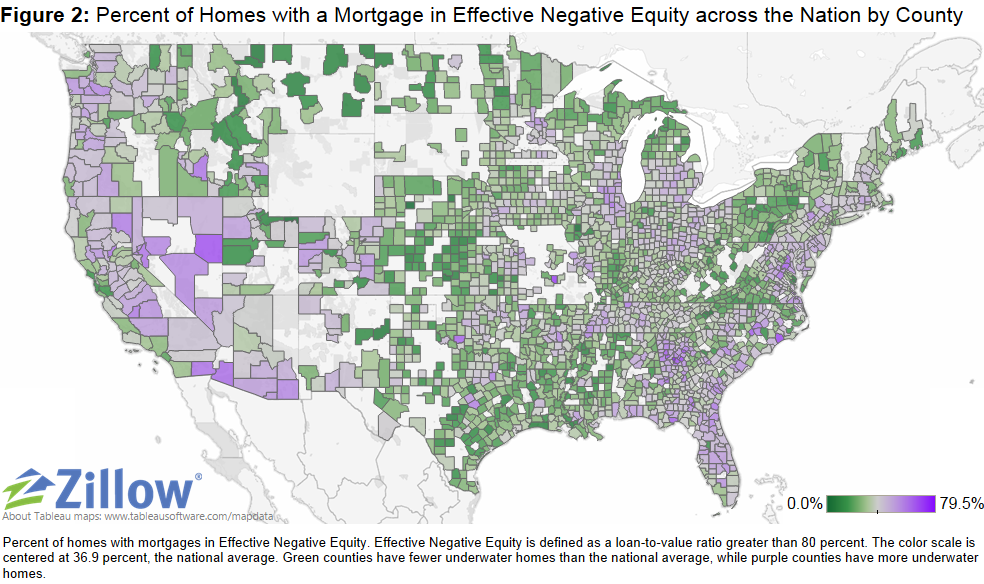
Moreover, the effective negative equity rate nationally — where the loan-to-value ratio is more than 80 percent, making it difficult for a homeowner to afford the down payment on another home — is 36.9 percent of homeowners with a mortgage. While not all of these homeowners are underwater, they have relatively little equity in their homes, and therefore selling and buying a new home while covering all of the associated costs (real estate agent fees, closing costs and a new down payment) would be difficult (Figure 2). Of all homeowners – roughly one-third of homeowners do not have a mortgage and own their homes free and clear – 13.2 percent are underwater.
Inventory
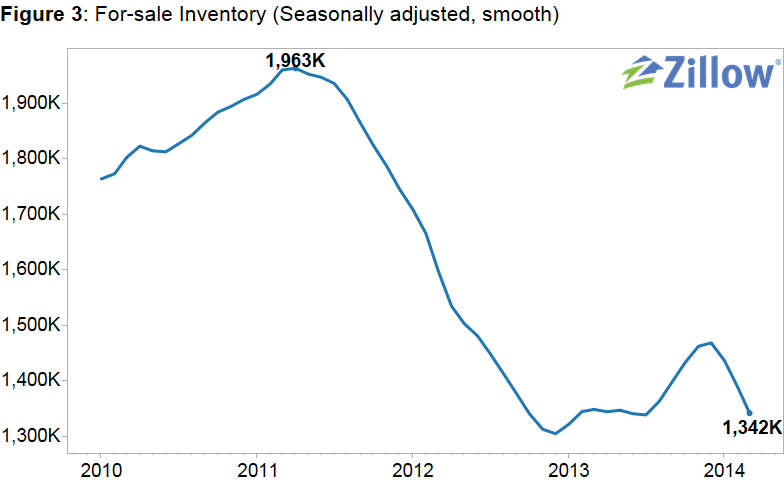
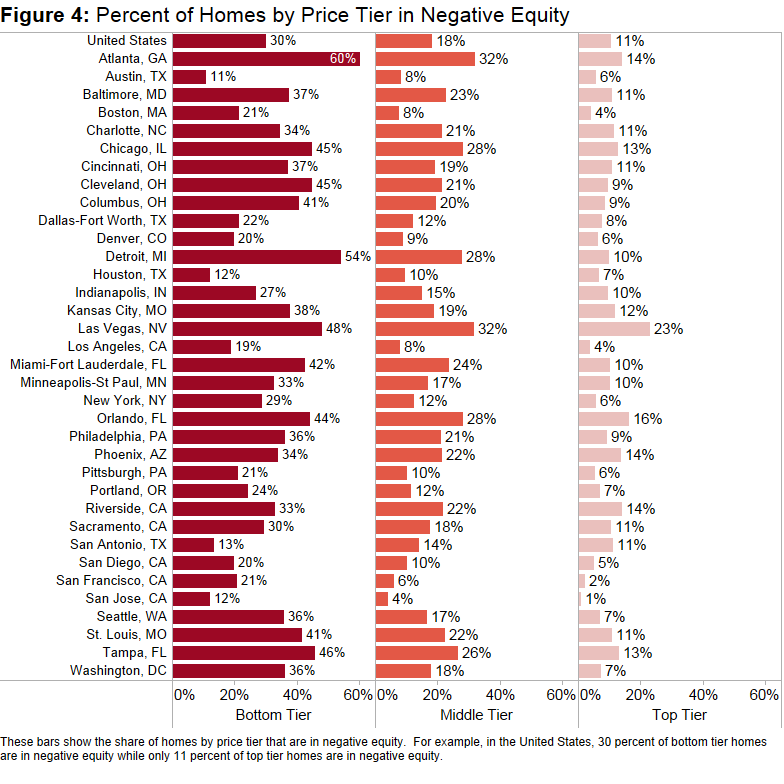
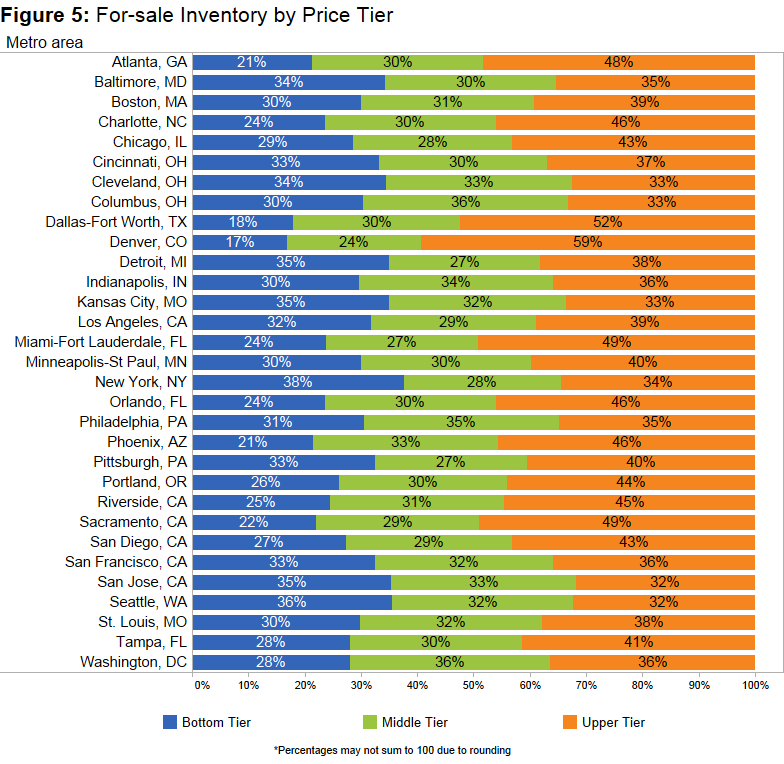
Mounting home value declines during the housing recession led to historically high levels of negative equity, which in turn severely restricted the available for-sale inventory in the marketplace. Figure 3 shows national for-sale inventory that has been seasonally adjusted and smoothed. It is very difficult for an underwater homeowner to list their home for sale without engaging in a short sale or bringing cash to the closing table. The bulk of negative equity has accumulated in the bottom tier – the bottom third of homes by home value – in most markets across the nation, which has led to especially tight inventory conditions among lower valued homes. Figure 4 shows the share of homes by price tier in negative equity. Nationally, among all homes with a mortgage, roughly one in three (30.2 percent) priced within the bottom third of home values were underwater, compared to 10.7 percent of homes in the top third and 18.1 percent of homes in the middle third. Figure 5 shows the inventory levels across the different price tiers for March for the largest metros, showing the largest inventory shortages among the bottom tier.
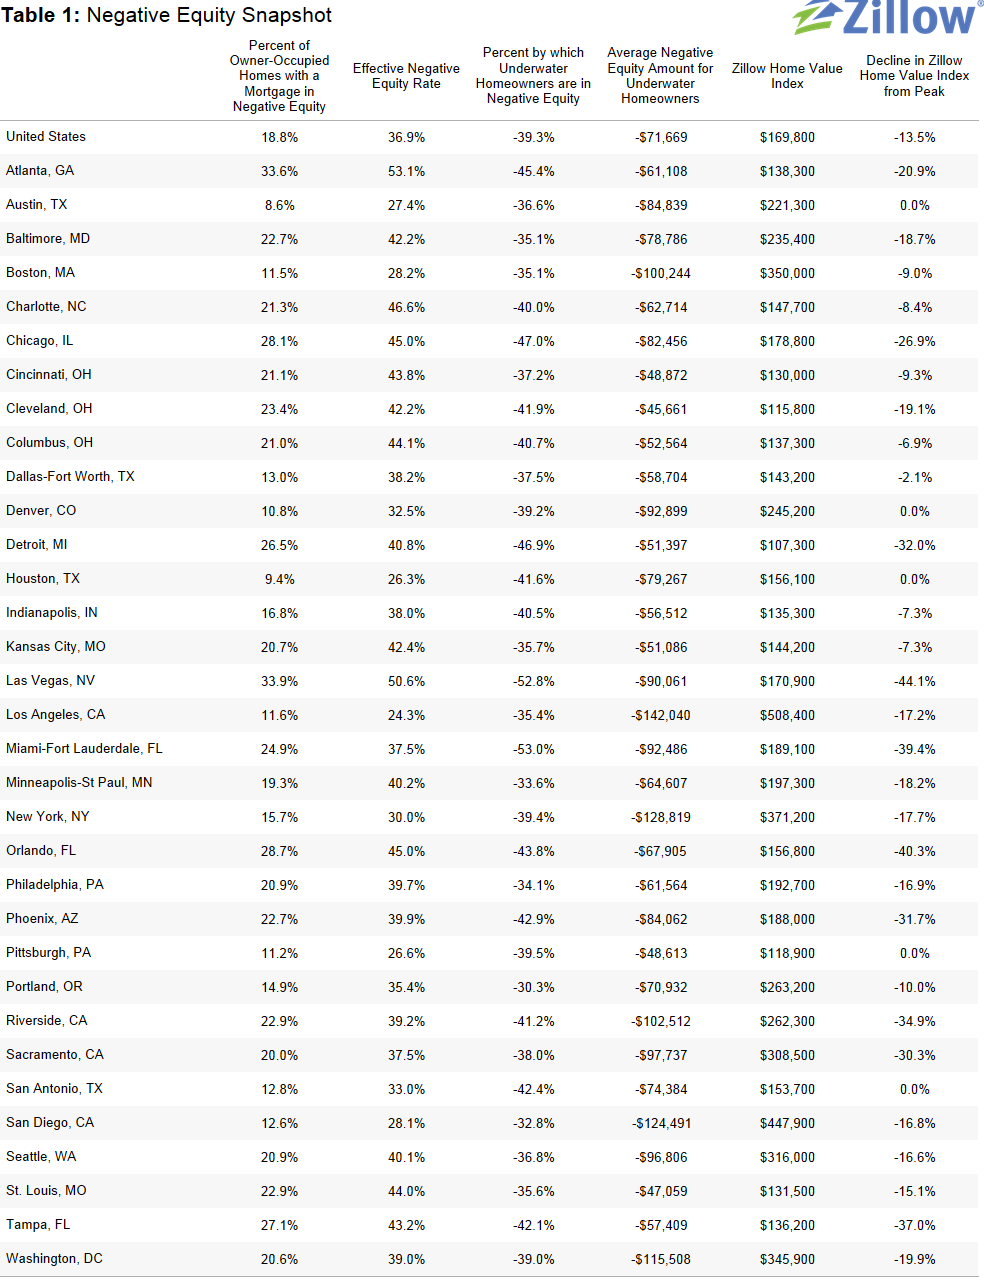
Despite continuing declines in negative equity, especially in some metros, such as Miami (down 1.8 percentage points from the previous quarter) and Riverside (down 1.5 percentage points), which are still experiencing abnormally high rates of home value appreciation, negative equity levels still remain very high and will be slow to dissipate as home value appreciation and foreclosure activity slows. Therefore, inventory will remain impacted for several years to come. This will continue to affect first time home buyers’ ability to find affordable homes. Furthermore, even if potential home buyers are able to find a house they want and in theory can afford, many of them don’t have enough equity in their current home to make the move.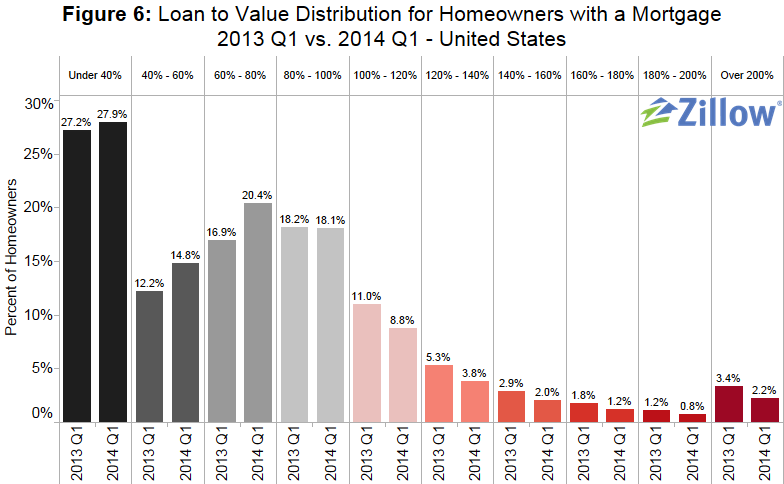 Figure 6 shows the loan-to-value (LTV) distribution for homeowners with a mortgage in 2014 Q1 versus 2013 Q1. The bulk of underwater homeowners, roughly 47 percent, are underwater by up to 20 percent of their loan value, and will soon cross over into positive equity territory. However they will still be effectively underwater, as they will not gain enough of a profit in the sale of their current house to pay the expenses and down payment associated with buying a new home. Nationally the effective negative equity rate stands at 36.9 percent of all homeowners with a mortgage. Therefore, in a move-up market, homeowners with less than 20 percent equity will effectively still be “locked” out of the resale market. On average, a U.S. homeowner in negative equity owes $71,669 more than what their home is worth, or 39.3 percent more than the home’s value (Table 1). While roughly a fifth of homeowners with a mortgage are underwater, 92.8 percent of these homeowners are current on their mortgage payments.
The Zillow Negative Equity Report incorporates mortgage data from TransUnion, a global leader in credit and information management, to calculate various statistics. The report includes, but is not limited to, negative equity, loan-to-value ratios and delinquency rates. To calculate negative equity, the estimated value of a home is matched to all outstanding mortgage debt and lines of credit associated with the home, including home equity lines of credit and home equity loans. All personally identifying information (“PII”) is removed from the data by TransUnion before delivery to Zillow. Overall, this report covers more than 870 metros, 2,400 counties, and 23,000 ZIP codes across the nation.
Regional Trends
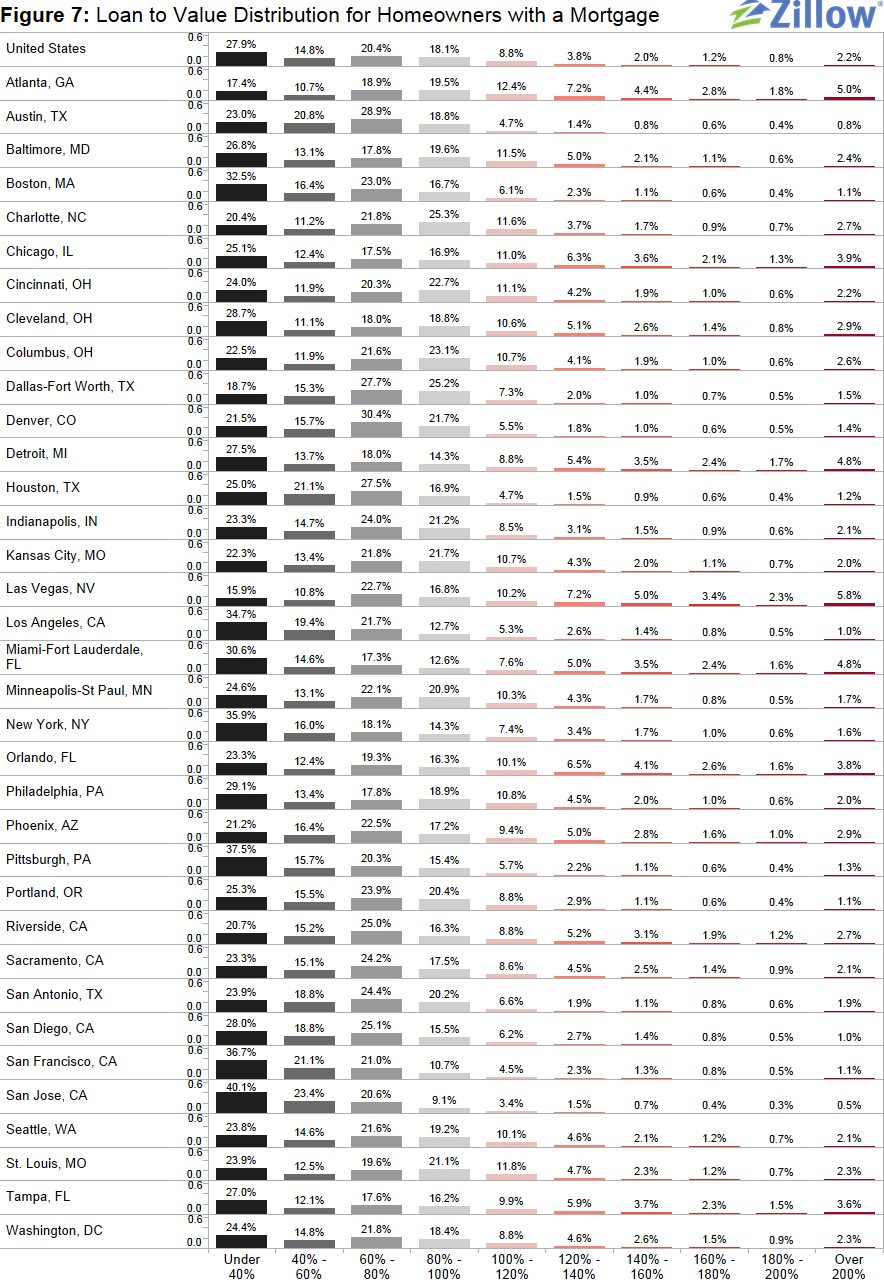
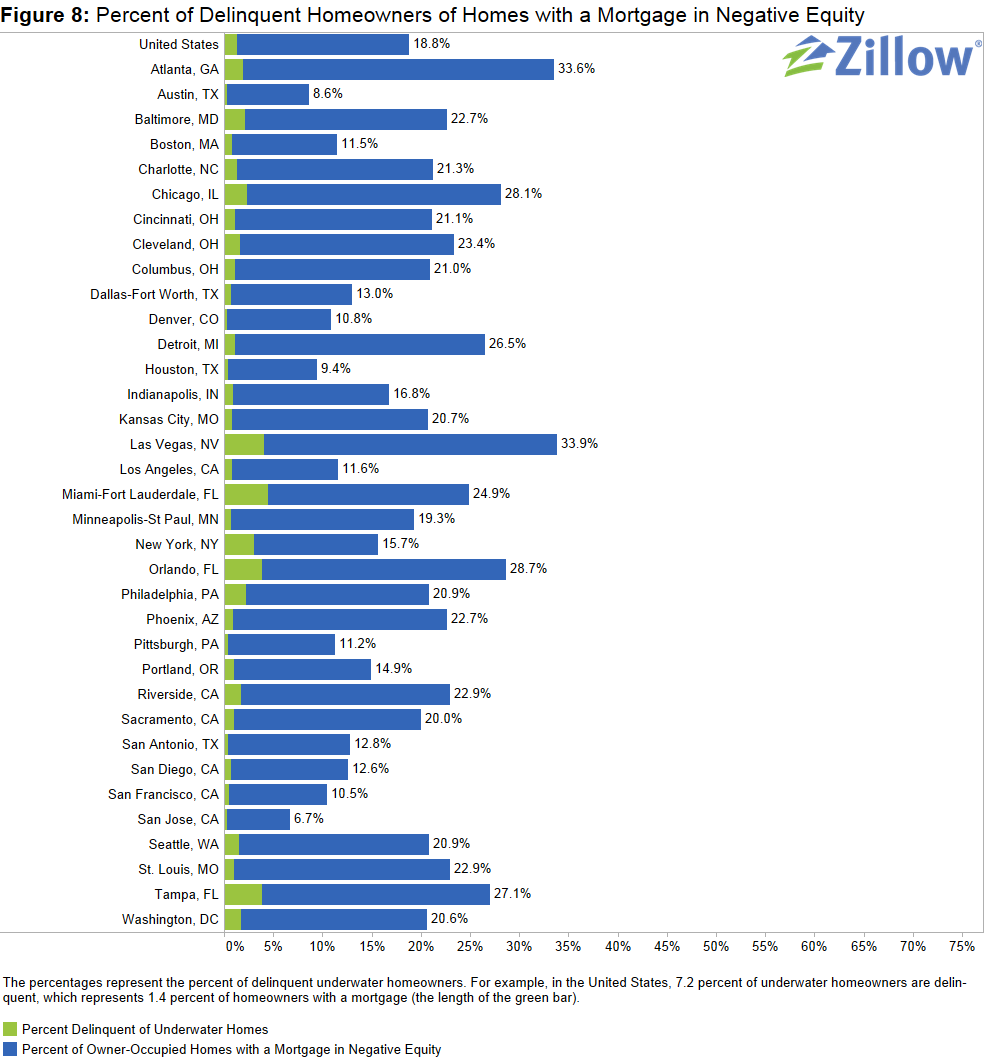
While the national negative equity rate is 18.8 percent, on the metro level there is wide variation in negative equity, with the percentage of underwater borrowers ranging from 0.8 percent to 48.5 percent. Furthermore, there is wide variation in how deeply homeowners are underwater. Figure 7 provides an overview of the distribution of the loan-to-value ratio for the largest metropolitan areas (a loan-to-value ratio greater than 100 percent means that the homeowner is underwater). While negative equity makes a household more vulnerable to foreclosure, most homeowners in negative equity will not end up in default. The majority of underwater homeowners continue to make regular payments on their mortgages, with only 7.2 percent of underwater homeowners being delinquent, down from 9 percent a year ago. This implies that 1.4 percent of all homeowners with a mortgage are at high risk for foreclosure near-term. Figure 8 shows a breakdown of these numbers for the top 35 metros.
Forecast
The Zillow Negative Equity Forecast predicts the negative equity rate among all homeowners with a mortgage will fall to at least 17 percent by Q1 2015. However, the Zillow Negative Equity Forecast is a conservative estimate of what negative equity rates will be a year from now. To forecast negative equity, we take the current home value of a house and appreciate it by the Zillow Home Value Forecast (ZHVF) for the MSA in which the home is located. In cases where there is no ZHVF available, we use the historical rate of home appreciation, and for metros that don’t have a historical rate of appreciation we use the historical rate of inflation at the national level. For homes that are not located in a metropolitan area, we use the forecasted national rate of appreciation. To calculate the level of home equity a year from now, we use the forecasted home value and the current outstanding debt balance, where we make no assumptions about a homeowner’s debt level a year from now. We also make no assumptions about foreclosure activity in the coming year. Therefore, this forecast is a very conservative one, as homeowners will likely continue to pay down their debt throughout the year, and homes will likely continue to be foreclosed on, and both of these factors will contribute to a lower negative equity rate. The Zillow Negative Equity Forecast can therefore be considered a higher bound estimate of negative equity.
Outlook
Negative equity continues to impact the market. Especially as we focus on inventory, we found that a relatively high rate of negative equity among the bottom third of homes in terms of value is causing tight inventory, as there are very few lower-end home available for sale in the marketplace. This bottom third is also where a lot of demand has been focused, as investors had often bought up relatively inexpensive homes to convert them to rentals, and many first time homebuyers wanting to get back into the market are considering starter homes or more affordable homes. Negative equity will have an impact on the market for the foreseeable future, as the rate of decline has slowed with slowing home value appreciation. Our home value forecast calls for 3.3 percent appreciation from March 2014 to March 2015 given this forecast, and we expect that negative equity rates will continue to decrease in the next year to a rate of, at most, 17 percent by Q1 2015.