Uncategorized
Key Takeaways From the December Existing Home Sales Report
Existing home sales increased 14.7 percent from November to December to 5.46 million units, at a seasonally adjusted annual rate (SAAR), according to the National Association of Realtors. Buoyed by regulatory changes that likely pushed some closings into December from November, existing home sales more than reversed the 10.5 percent decline reported from October to November.
- Existing home sales jumped 14.7 percent month-over-month in December, to 5.46 million units (SAAR), more than reversing the 10.5 percent decline reported in November.
- The end-of-year volatility is likely the result of regulatory changes surrounding the implementation of new mortgage disclosure rules, which pushed some closing from November into December.
- The median seasonally adjusted price of existing homes sold reached a new all-time high of $229,000, surpassing its pre-crisis peak for the first time.
Existing home sales increased 14.7 percent from November to December to 5.46 million units, at a seasonally adjusted annual rate (SAAR), according to the National Association of Realtors. Buoyed by regulatory changes that likely pushed some closings into December from November, existing home sales more than reversed the 10.5 percent decline reported from October to November (figure 1). Over the year, existing home sales are up 7.7 percent.
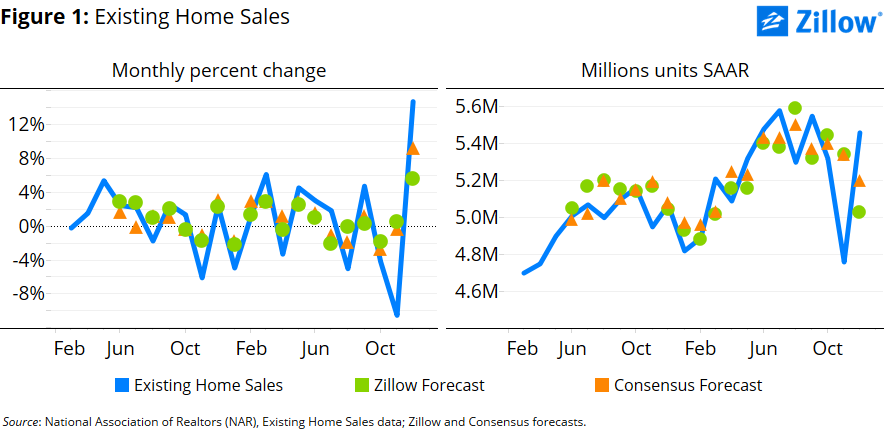 Sales certainly did rise last year: 2015 was the best year for existing home sales since 2006, and even ended up recording slightly more than the number of sales in the relatively stable housing market years of 1999 and 2000. But in 2015, the labors of spring did not necessarily yield a fall harvest: After a strong start to the year, upward momentum puttered out in late summer, and the trend for the second half of the year was decidedly downward. Home sales increased 15.8 percent from January to July, but then fell 2.2 percent from July to December.
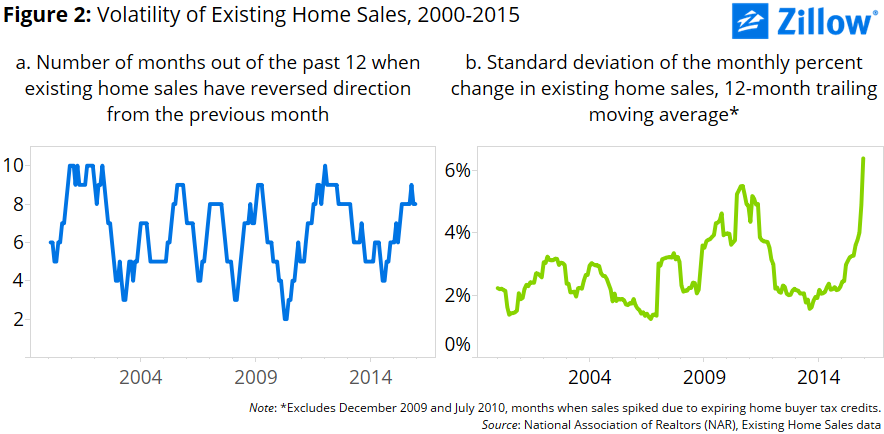
Existing home sales have been particularly volatile over the past year. In eight of the past 12 months, home sales have reversed direction from the previous month (figure 2a) – an increase in existing home sales is followed by a decrease, or vice versa. This level of volatility ranks in the top quintile of months ranked by this measure of volatility going back through the history of the series.
Another way to look at the volatility in existing home sales is to consider the standard deviation of the month-over-month percent change in sales –essentially, how far away from the average monthly percent change each month’s data has gotten. The trailing 12-month moving average of the standard deviation of the month-over-month change in existing home sales is now higher than it has ever been (excluding December 2009 and July 2010, when home sales surged due to expiring homebuyer tax credits). The big swings of the past two months played a large role in this trend (figure 2b).
 The median seasonally-adjusted price of existing homes sold continued its upward march, rising 2.1 percent to $229,000 in October from $224,100 in November, up 7.7 percent from a year earlier. The seasonally adjusted median price of existing homes sold is now at all-time highs, after surpassing its pre-crisis peak of $227,200 reported in November 2005.

