Uncategorized
Key Takeaways from the August New Home Sales Report
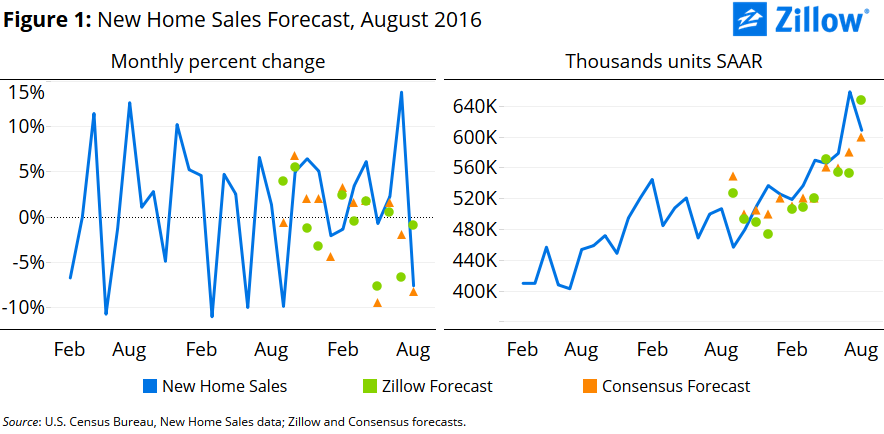
August new home sales fell 7.6 percent from July to 609,000 units at a seasonally adjusted annual rate (SAAR), according to the U.S. Census Bureau, the largest month-over-month percent drop in new home sales in almost a year.
- August new home sales fell 7.6 percent from July to 609,000 units (SAAR), according to the Census Bureau, retreating from July’s strong sales.
- New home sales fell in August from July in the Northeast, Midwest and South, but increased in the West.
- The median seasonally adjusted price of new homes sold in August was $285,600, the lowest median sales price since September 2014.
August new home sales fell 7.6 percent from July to 609,000 units at a seasonally adjusted annual rate (SAAR), according to the U.S. Census Bureau, the largest month-over-month percent drop in new home sales in almost a year.
But compared to a year ago, new home sales remain up 20.1 percent. July new home sales were revised upward by 5,000 units to 659,000 units (SAAR), bumping July’s month-over-month increase from June to 13.8 percent from an initially reported 12.4 percent (figure 1).
 Compared to July, August new home sales fell by 34.3 percent in the Northeast, 2.4 percent in the Midwest and 12.3 percent in the South, but rose by 8 percent in the West. Over the year, new home sales were up in all major regions (by 39.7 percent in the Midwest, 15.9 percent in the South and 35 percent in the West) except the Northeast (-25.8 percent). Regionally, the market for new homes has fared very differently: Since August 2011, new home sales are up 25 percent in the Northeast, 67 percent in the Midwest, 86 percent in the South and 98 percent in the West.
The inventory of new homes for sale nationwide in August increased 1.7 percent from July, to 235,000 units (SAAR), and is up 8.3 percent over the year. On-market inventory is now growing at a pace roughly in line with trends observed last fall. Regionally, on-market inventory is growing fastest in the Northeast (up 18.2 percent from last year, although from very low levels) and is growing slightly faster in the South (10.5 percent year-over-year) than in the West (9.6 percent).
The median seasonally adjusted price of new homes sold in August pulled back 3.7 percent from July, to $285,600, down 5.3 percent from last year. It was the lowest median price of new homes sold since September 2014, and the second consecutive month in which the median price of new homes sold fell both over the month and over the year.
This is a clear signal that home builders are starting to address a less expensive market segments than they have in recent years. The largest growth in new home sales was in the price tier between $200,000 and $299,000, the market just below the median-priced new home but still largely above the median price of existing homes sold in August. So while there are more more-affordable new homes on the market, there is still a substantial premium for new homes and it is still a pricier market than the market for existing homes. Moreover, the upper tails of the price distribution of new homes sold in August also saw modest increases in their market share, suggesting that builders aren’t ignoring the high end of the market.

