- The vast majority of homes currently in existence were constructed in 1950 or later.
- Nationally, the decade that makes up the largest share of the existing housing stock is 2000-2009.
How old a home is, and where it is, can say a lot about its character—and its owner.
Have you always admired the style and sophistication of the Roaring Twenties and looked for that perfect jazz-age fixer-upper? Head to Washington, D.C. Or are you modern, more interested in contemporary design and 21st century amenities? Then look west, to Nevada and Arizona, to find the largest share of newer homes in the country.
Zillow analyzed the distribution of the housing stock built since 1900, in each state, by age[i]. Homes were grouped by the decade in which they were constructed, covering a total of 12 decades including the current, incomplete decade that began in 2010. This analysis does not include prior construction that has been torn down and either destroyed or rebuilt.
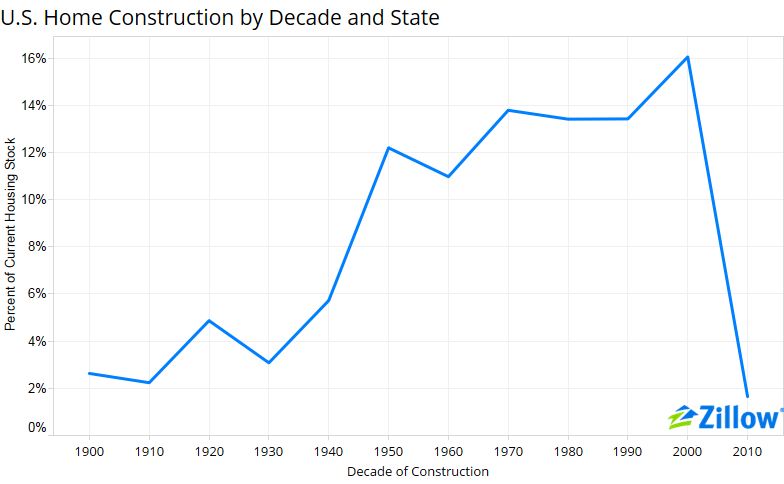
Nationwide, homes built between 2000 and 2009 represent the largest share of existing homes constructed, with 16 percent of all homes built during those 10 years. Eleven percent of all U.S. homes were constructed before 1950. Homes built before 1920 account for just 3 percent of the current housing stock. Each decade from 1950 through 2010 accounts for at least 10 percent of the current housing stock. And even though we are only halfway through the current decade, the pace of construction is well below the pace set in the latter half of the 20th century and into the previous decade.
While what’s true for the nation is generally true in individual states and the District of Columbia, there are some exceptions. The largest portion of Washington, D.C.’s housing stock was built in the 1920s, and each subsequent decade through the 1970s accounts for a declining share.
Nevada and Arizona, two of the states hit hardest by the housing bubble, have the largest shares of homes built from 2000 to 2009, at 36 percent and 29 percent, respectively.
The largest share of homes in Michigan and New York were constructed during the post-World War II construction boom of the 1950s—20 percent of existing homes in Michigan and 17 percent in New York were built during the Eisenhower-era.
Use the interactive graph below to explore the distribution of the current housing stock by age and state.
[i]Data on individual, single-family homes was aggregated by decade and by state to find the distribution of age of the current housing stock. The year of construction was limited from 1900 to 2014.
