- There are 5.9 percent fewer homes for sale in the U.S. than there were a year ago.
- There are 10.4 percent fewer entry-level homes for sale in the U.S. than there were a year ago.
- Low supply is driving up home prices among entry-level homes, which are often sought after by first-time buyers.
Faced with rapidly appreciating home values and a dwindling inventory of homes for sale in the critical entry-level and mid-market home segments, first-time and move-up home buyers – typically the housing market’s bread-and-butter – are likely in store for a tough spring home shopping season.
Nationwide, median home values rose 4.8 percent year-over-year in March and 1.1 percent over the course of the first quarter, to a Zillow Home Value Index of $186,200, according to the first quarter Zillow Real Estate Market Report. And while overall U.S. home values continue to grow at a modest (though slowly accelerating) clip, home values are rising the fastest among entry-level and mid-market homes in a large majority of the nation’s biggest housing markets.
A number of factors are driving this growth, and many are positive, including strengthening household formation, continued growth in jobs and wages, and general confidence and optimism in the overall value of homeownership, especially among younger generations. But the likeliest contributor to this rapid growth in the bottom and middle is worrisome: There is a real lack of homes to buy in these segments.
Brutal at the Bottom…
Overall, there were 5.9 percent fewer homes available for sale nationwide at the end of the first quarter than there were a year ago. But the number of homes for sale in the bottom and middle thirds of the U.S. market each fell by 10.4 percent, compared to a relatively scant decline of just 1.9 percent in the top third of the market.
This is leading to a situation in which the majority of homes for sale in many markets are more expensive homes not typically sought by budget-conscious entry-level and younger buyers. In all 35 of the nation’s largest markets and the U.S. as a whole, more homes are available for sale in the top-third of the market than in either of the other segments. In nine of those large metros, top-tier homes make up more than half of all homes available for sale.
And strong demand for more-affordable homes, driven in part by those healthy fundamentals noted earlier, can’t help but push prices up more quickly for those budget-friendly homes that are available. Home values in the bottom tier are growing faster than the other two tiers in 18 of the nation’s 35 largest metro housing markets, and middle-tier growth is outpacing bottom and top-tier growth in another eleven. That leaves just six of the country’s 35 largest markets in which home value growth in the top tier is outpacing the bottom and middle.
And in some cases, the growth rates between top and bottom tiers aren’t particularly close. In the fast-growing Denver metro, for example, bottom-tier home values grew at a 20.3 percent annual pace in March, fastest among markets in which bottom-tier values are growing the most, and almost double local top-tier annual growth of “just” 10.6 percent. Similar trends can be found in Phoenix, where bottom-tier home values are growing at almost triple the annual pace of top-tier values (11.2 percent at the bottom vs. 4.2 percent at the top) and Riverside (10 percent vs. 2.7 percent).
…Tranquil at the Top
This rapid home value appreciation and limited inventory in the bottom two-thirds of the market undoubtedly puts a majority of would-be home buyers in a tough spot. But the flip side is that those better-heeled buyers in search of a top-tier home are swimming in much smoother waters.
Annual home value growth among top-tier homes in 20 of the nation’s top 35 markets is slower than the overall national pace of 4.8 percent. Additionally, the most expensive homes on the market are also more likely to have a price cut. The share of top-tier listings nationwide with a price cut has increased 1.6 percentage points over the past year, compared to just 0.4 percentage points in the middle tier and 0.5 percentage points at the bottom.
In other words, buyers looking for the most expensive homes will find somewhat softening prices, a relatively larger selection of homes to choose from and more limited competition this spring. At the same time, entry-level and mid-market buyers are likely to face much stiffer competition, rapidly rising prices and very limited inventory.
Yet another reminder that it pays to be wealthy.
Home Value Growth Re-Accelerating
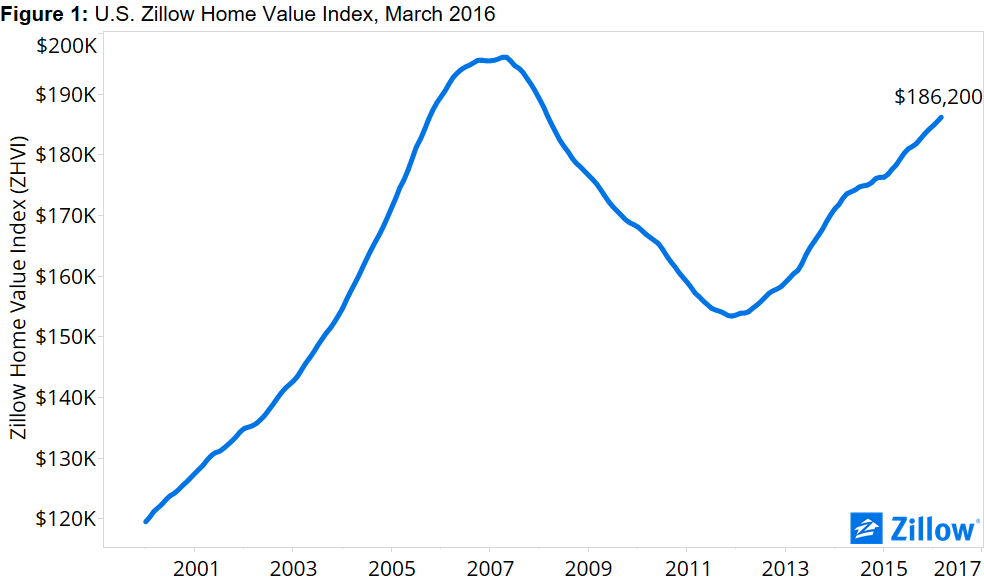 In March, the median U.S. home value rose 0.4 percent from February, according to the Zillow Home Value Index. U.S. home values have grown on a year-over-year basis for 45 straight months (figure 1).
But while home values have been growing consistently for going on four years, lately, the pace of growth has picked up after a yearlong cooling-off period from spring 2014 through spring 2015. The post-bottom pace of annual home value growth peaked at 7.9 percent in April 2014, then slowed in each of the subsequent 12 months, reaching a low of 2.7 percent in April 2015. Annual home value growth has since been higher than the month before in 10 of the past 11 months, before falling somewhat in March to a 4.8 percent pace, from 4.9 percent in February.
While annual growth in this range is largely sustainable and not much to worry about on its own, this uptick in growth bears watching as the spring home shopping season heats up – especially in light of the rapid growth and limited inventory issues noted earlier. If home values begin growing too much, too fast, many more buyers risk getting priced out of the market, which has a number of trickle-down effects. One of these impacts could be felt in the rental market, as would-be buyers are stuck renting for longer, keeping apartments occupied that may otherwise go to newly formed renter households and contributing to upward pressure on rents themselves. Another impact could be continued deterioration in home affordability overall if growth in home values outpaces income growth.
Home values in 25 of the nation’s 35 largest metro markets grew faster year-over-year than the nation’s 4.8 percent annual pace in March. Home values grew by more than 10 percent per year in seven of those large metro markets: Denver (up 15.7 percent year-over-year), Portland (14.8 percent), Dallas (13 percent), San Jose (12.6 percent), Seattle (11.7 percent), San Francisco (11.5 percent) and Miami (10.5 percent). None of the nation’s largest metros experienced annual home value declines in March.
Rents Creeping Back Up
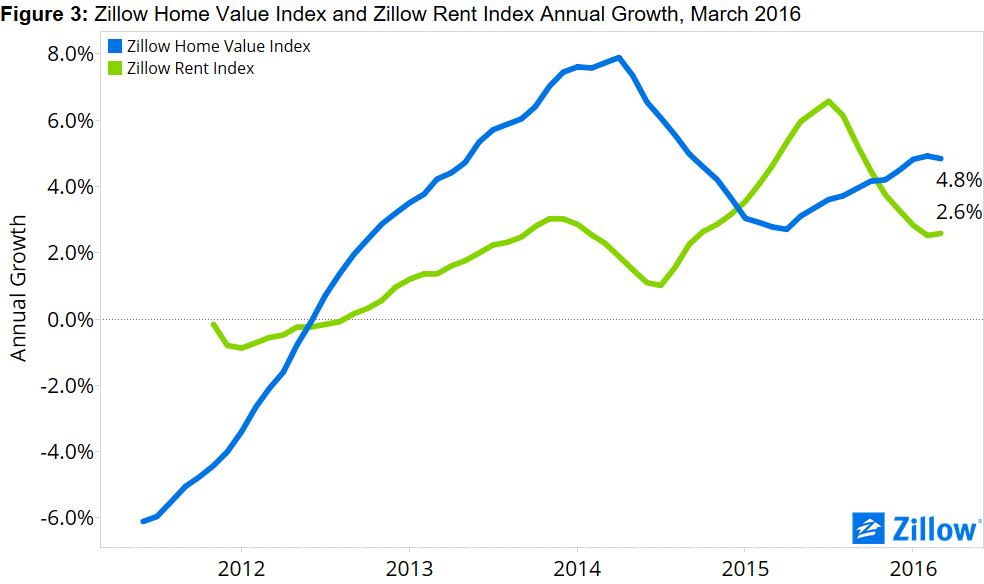
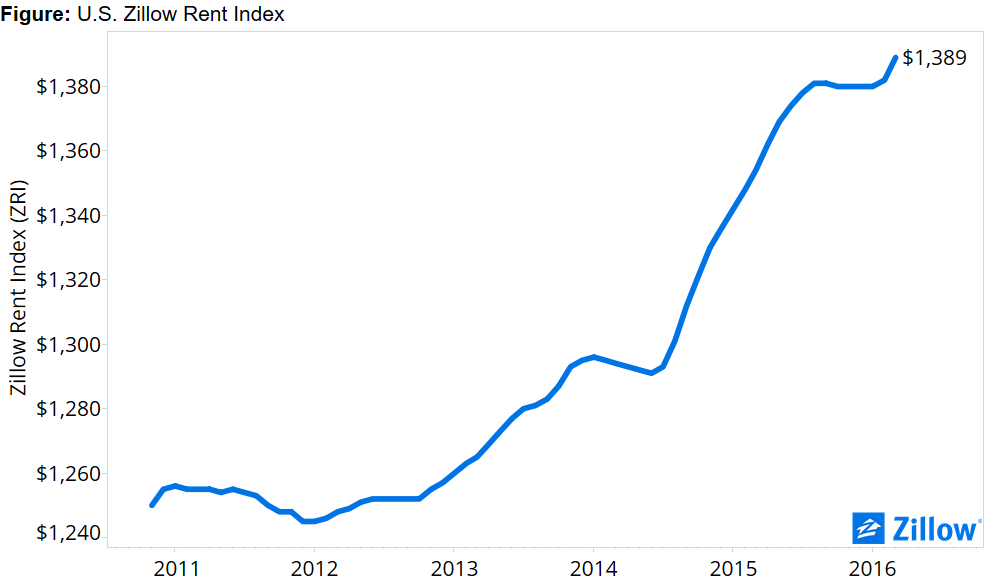 The U.S. median rent in March was $1,389 per month (figure 2), up 0.5 percent from February and 2.6 percent from March 2015, according to the Zillow Rent Index. U.S. rents have grown year-over-year for 43 consecutive months. March was the fifth straight month in which median U.S. home values grew faster year-over-year than median rents (figure 3).
Similar to home value growth, annual growth in rents in this range is normal and nothing to worry much about. However, between August 2015 and February, monthly rents in each of those seven months hovered between $1,380 and $1,382, before rising to the current $1,389 this month. This $7 per month bump isn’t huge by any means, but does represent a bit of a departure from recent trends, and could be an early signal that rental growth is picking up again, potentially as a result of tightness in the rental market caused by renters unable to find a home to buy in their budget. This also bears watching.
 Median rents in all but one of the nation’s 35 largest metro markets grew year-over-year to some extent, with only Cleveland experiencing an annual decline (-1.2 percent from March 2015). Rents grew fastest year-over-year in the San Francisco (up 9.9 percent from March 2015), Portland (up 8.6 percent) and San Jose (up 8 percent) metros.
Outlook
Looking ahead, Zillow expects national home values to continue growing, rising another 2.7 percent through March 2017 to a Zillow Home Value Index of $191,257. U.S. rents are also expected to keep growing over the next year, at a 2.7 percent pace through March 2017 to a Zillow Rent Index of $1,426.
Existing home sales activity in March was fairly strong, a somewhat promising sign for the upcoming spring season after a disappointing February. But existing home sales have been very volatile lately, and have failed to string together more than a couple months in a row of increases before stumbling again. It will take several solid months this spring to break the two-steps-forward, one-step-back routine the market has been stuck in for a while – and it’s hard to meaningfully increase sales activity when the number of homes for sale keeps dropping.
Which means the market could be setting up to be pretty tough for potential buyers this spring, especially for first-time buyers and those looking to move up from their first home and into a slightly more expensive place. Competition will be fierce, and buyers’ patience will be tested. In order to stand out in a competitive market, buyers should get pre-approved for a loan, find an agent who has experience with bidding wars and be prepared to come in at the asking price, so the seller knows they’re serious.

