- Nationally, 12.7 percent of homeowners with a mortgage owed more than their homes were worth in Q1 2016, down from a high of 31.4 percent in Q1 2012.
- Chicago displaced Las Vegas as the large housing market with the highest rate of negative equity, with 20.3 percent of homeowners underwater.
- The Bay Area has the lowest rates of negative equity among large markets. San Jose and San Francisco are the only two large metros with negative equity rates below 5 percent.
As negative equity overall continues to fall, the epicenter of underwater homeowners in the U.S. has shifted from the notoriously hard-hit – but quick to recover – Southwest and Southeast, to the long-suffering and sluggish rust belt states. The shift is reflective of a housing market that has evolved from one driven by largely temporary factors caused by the massive housing boom and bust, to one driven by more fundamental, traditional factors like job growth, supply and demand.
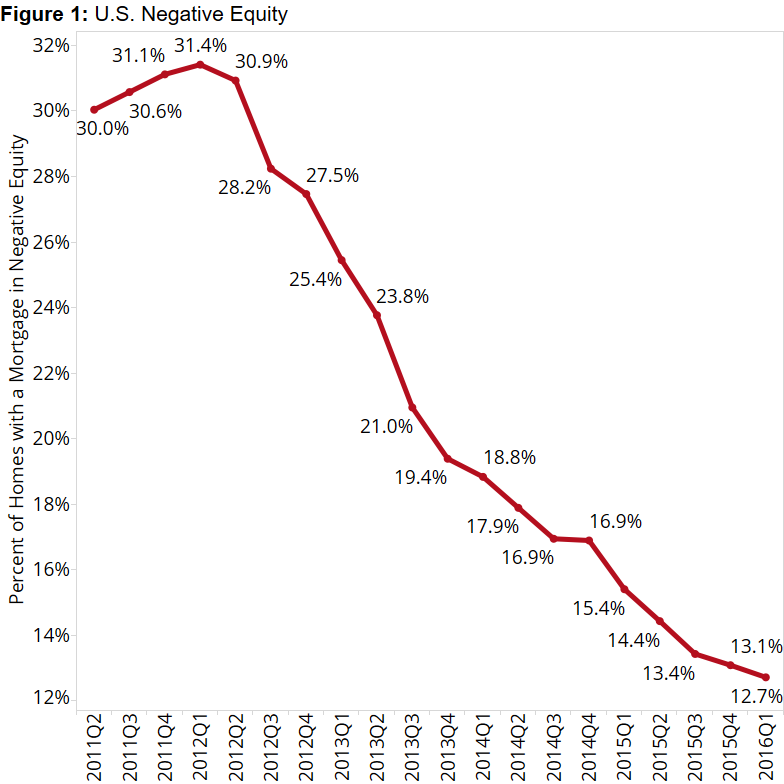 The national negative equity rate – the share of all homeowners with a mortgage who are underwater, owing more on their mortgage than their home is worth – fell to 12.7 percent in the first quarter of 2016, according to the first quarter Zillow Negative Equity Report. The U.S. negative equity rate is down from 13.1 percent in Q4 2015 and 15.4 percent a year ago, and has fallen or stayed flat from the prior quarter for 16 straight quarters after peaking at 31.4 percent in Q1 2012 (figure 1).
The steady decline in negative equity nationwide has been driven by a consistent recovery in home values over the past several years. But while home values have risen to some extent in a large majority of U.S. markets, some markets have recovered much more quickly than others, and the concentration of negative equity nationwide has shifted from the Southwest and Southeast to the Midwest (figure 2).
 Pounding Sand
During the housing boom, hundreds of thousands of new homeowners flocked to markets in the “sand states” (Arizona, California, Nevada and Florida), attracted by a number of factors, including traditional draws like low costs and good weather, as well as relatively strong job growth. The large amount of relatively inexpensive housing being built in these locales, and readily available home financing (too available, as it turned out), also helped these areas boom. But when millions of Americans began losing their jobs in late 2007 and into 2008, demand for the glut of new homes being built in these areas evaporated, pushing local home values down sharply. And because so many homeowners purchased their homes with little or even no money down, negative equity soared as home values plummeted.
At its peak, negative equity in the Las Vegas area reached 71 percent. In Phoenix, the negative equity rate peaked at 58.1 percent. At its worst, more than half of all homeowners with a mortgage were also underwater in Riverside and Sacramento (53.4 percent and 51.2 percent, respectively), and almost half (47 percent) of such homeowners were underwater in and around Miami.
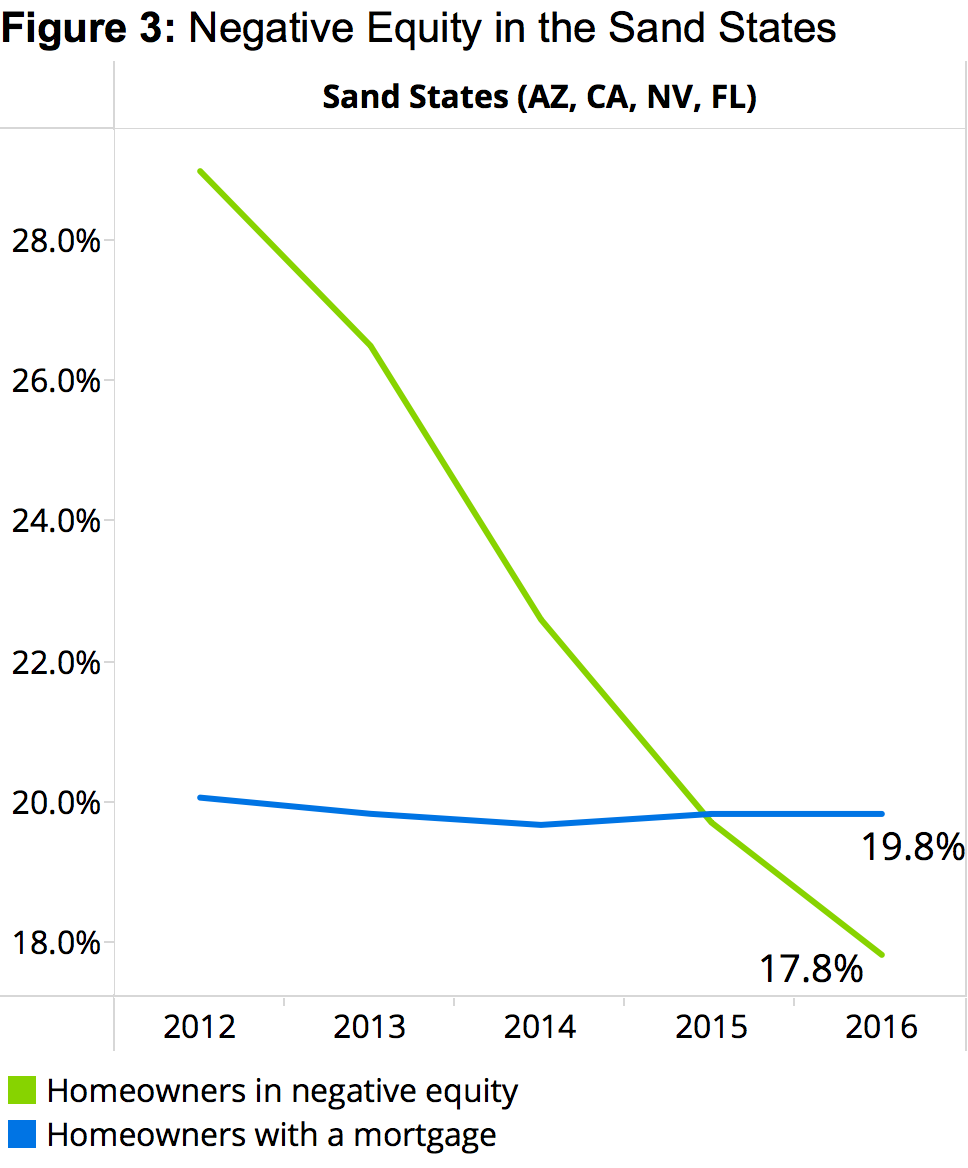
 Hit disproportionately hard by the housing bust, these markets ended up carrying a disproportionate amount of the nation’s negative equity into the early years of the housing recovery. In 2012, 20.1 percent of the nation’s homeowners with a mortgage lived in the sand states. But 29 percent of the country’s underwater homeowners lived in those areas (figure 3).
But more than any kind of inherent or structural problem with underlying local economic fundamentals, sand-state markets, along with many other markets across the nation, were victim to a series of largely one-off problems brought on by a wave of overbuilding and a temporary lapse in mortgage underwriting standards. When jobs started coming back and home values began recovering, the same draws that lured hundreds of thousands of new residents and retirees to those areas were largely still intact: Good weather, a relatively low cost of living, abundant housing and decent job opportunities.
From the outset of the recovery, these markets were well-positioned to quickly bounce back, and for the most part, they have: From January 2012 through March 2016, home values in Las Vegas have grown 77.1 percent. In Phoenix and Miami, median home values are up 55.8 percent and 62.7 percent, respectively, over the same time. For the U.S. as a whole over the same period, median home values are up just 21.4 percent.
Rust Belt Blues
But it’s a much different story in the nation’s former industrial heartland.
Markets in the nation’s rust-belt states – including Illinois, Indiana, Michigan, Ohio and Pennsylvania – were also hard-hit by the recession. But in the years prior to the bust, builders weren’t in as much of a rush to construct the huge amount of new homes seen in the Southwest and Southeast. These colder, Midwestern markets simply weren’t as attractive to retirees, vacationers, foreign-buyers or investors as the lights of Vegas or the beaches of Miami. As such, because there wasn’t the same kind of huge glut of housing in these areas, home values did not fall as far as fast during the bust as they did in the Southwest and Southeast, and negative equity didn’t reach as high. Negative equity peaked at 41.1 percent in Chicago, 33.9 percent in Cleveland and 29.9 percent in Indianapolis.
But while these kinds of markets may have been – even slightly – more insulated from negative equity at its peak, as the recovery has progressed these markets have also recovered more sluggishly. These markets all have much to recommend them, of course, but they will never really be able to compete on pure desirability with the weather of places like Phoenix and Miami. Instead, these markets have to attract new residents and growth by offering more job opportunities and higher wages. In this regard, the economic recovery that has seen tech hotbeds and coastal markets from Seattle to Boston prosper has largely left the rust belt states behind. Unemployment is more widespread and wages aren’t growing as quickly.
Because of this, home values have also not risen as quickly in the rust belt. From January 2012 through March 2016, median home values in the Chicago metro grew just 16.7 percent; in Cleveland, by 9.8 percent; and in Indianapolis by 10.1 percent, all well below the national average over the same time.
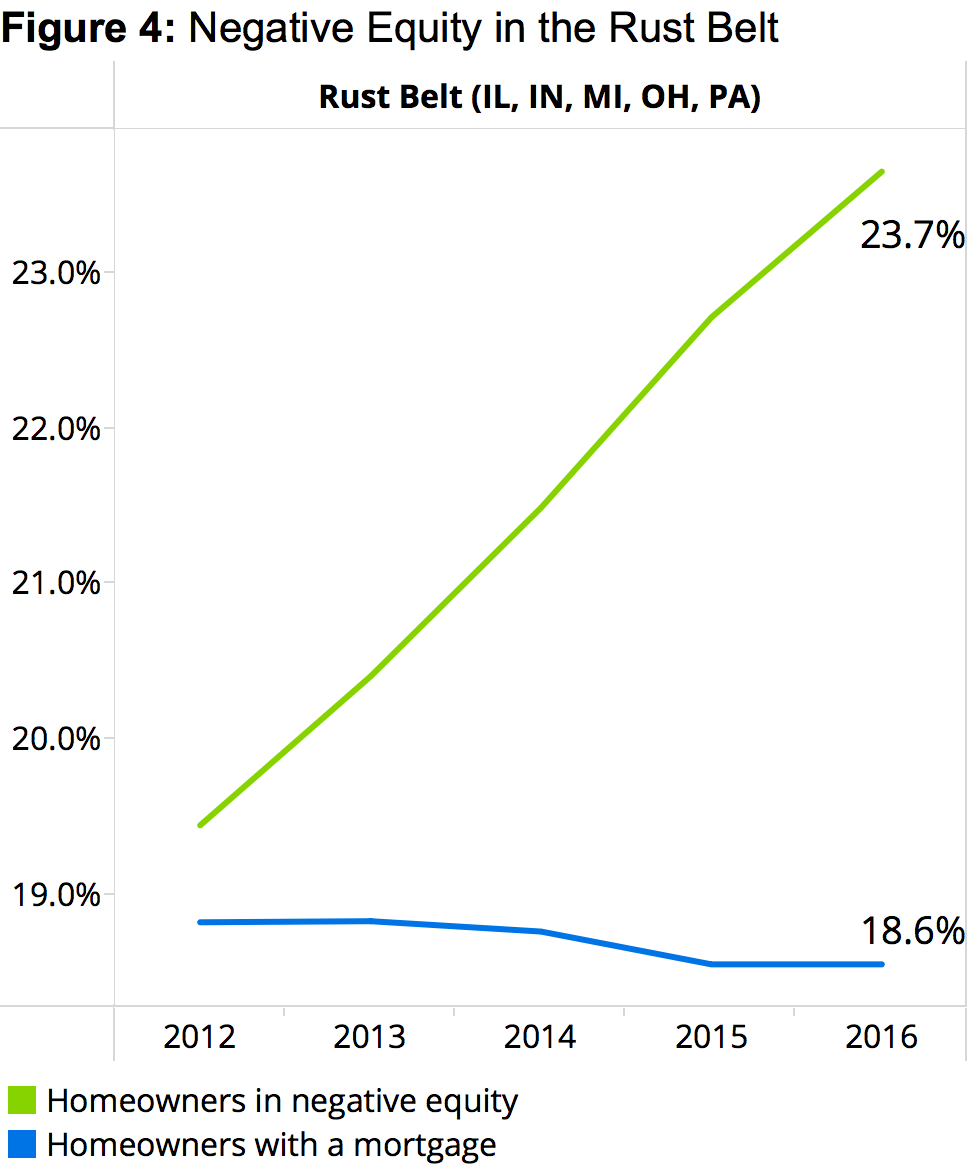
 In 2012, the share of all of the nation’s homeowners with a mortgage and the share of all of the nation’s underwater homeowners was roughly equal in the rust belt states, at 18.8 percent and 19.4 percent, respectively. Today, however, the imbalance has gotten much worse: 18.6 percent of the country’s mortgaged homeowners reside in the rust belt, but the area is home to 23.7 percent of all the nation’s underwater homeowners (figure 4).
For years, Las Vegas – and, by proxy, similar markets in the Southwest and Southeast – was the poster child of the nation’s housing bubble and bust and the negative equity crisis that followed. Since at least Q2 2011, the negative equity rate in the Las Vegas metro was highest among the nation’s 35 largest metros in every quarter – until Q1 2016. Now, the dubious honor of America’s most negative equity-ridden large market has been passed to Chicago. And given the rapidly diverging economic conditions in both those markets and other large markets nearby, the shift looks unlikely to reverse for many years.
High Pockets Persist
Of the 35 largest metro areas covered by Zillow, the negative equity rate in Q1 was highest in Chicago (20.3 percent), Las Vegas (20.2 percent) and Baltimore (17.2 percent). Large metros where negative equity was lowest in the Q1 were San Jose (2.8 percent), San Francisco (4.4 percent) and Portland (5.2 percent). Four of the 10 largest metros with the highest rates of negative equity are in the Rust Belt. Meanwhile, the West Coast is home to five of the 10 metros with the lowest levels of negative equity (figure 5).
Among the 35 largest markets covered, 18 had a negative equity rate lower than the national average of 12.7 percent in Q1, and 17 had a higher rate of negative equity.
Not Underwater, Still Drowning
Technical negative equity is easy to define: If the balance on a homeowner’s mortgage exceeds the value of their home, they’re underwater. But even those homeowners with some positive equity could still be trapped in the no-man’s land of “effective” negative equity. These homeowners may have some equity in their home, but likely not enough to sell it and use the proceeds to comfortably afford the down payment and other costs associated with buying a new home and selling their old one.
Including those homeowners with less than 20 percent equity in their home, the U.S. effective negative equity rate jumps to 29.2 percent of homeowners with a mortgage (figure 6). Large metro areas with the highest effective negative equity rates include Las Vegas (40.8 percent), Chicago (37.8 percent) and Baltimore (37.5 percent). Even the nation’s hottest markets – San Jose and San Francisco – aren’t immune to effective negative equity, with rates of 7.4 percent and 10.7 percent, respectively.
Outlook
When the housing bubble burst, the West Coast had more than its fair share of underwater homeowners. But the strong local economy and job markets have significantly helped these housing markets recover, and several are now more expensive than they were during the housing bubble. Other parts of the country didn’t get those same benefits, and until market fundamentals improve, homeowners and buyers in these areas will be facing disproportionately higher levels of negative equity as they navigate the housing market.
