Revisions to the ZHVI Methodology (2013)

With the release of November 2013 Zillow Home Value Index (ZHVI) data, we have made a number of methodological changes that impact both the current and historical levels of the ZHVI. Specifically, we have improved the underlying valuation model, introduced additional data filtering algorithms and developed a new approach to dealing with residual systematic error. The result of these changes led to a 24.1% increase in the number of regions for which Zillow reports a ZHVI. The historical values for the ZHVI have been restated with these changes, leading to a slightly higher current estimate of the median home value nationally. The revised ZHVIs are qualitatively similar to the ZHVI computed using the previous methodology, although the new time series are significantly smoother. The general approach to index creation remains unchanged and is described here, and the changes noted herein should be considered refinements to the earlier methodology.
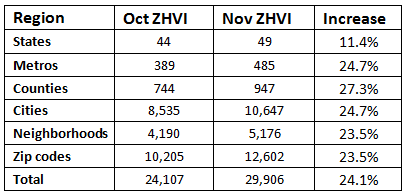
The improvements to the methodology have led to a substantially greater number of regions for which Zillow reports a ZHVI value. The table below shows the breakdown in the increase of the number of regions covered by the ZHVI, with a 24.1% increase overall. In addition to more reported regions, the time series for all regions are also smoother and generally more stable.
Table 1: Increase in reporting regions by region type from the previous methodology (October ZHVI) to the new methodology (November ZHVI)
The new valuation model and data filtering algorithms have led to a restatement of past values for the ZHVI. The revision of the ZHVI has generally raised the overall estimated median value of homes. The national median home value is higher by 3.2%: $168,000 versus $162,800 with the previous methodology. The increase is due to better accuracy of the new valuation model and better screening of transactions that are normally excluded from the ZHVI (e.g., foreclosures and foreclosure re-sales).
Qualitatively, the restated ZHVIs are similar to the ZHVIs calculated using the previous methodology, although they tend to have less volatility, particularly on shorter time scales. The size and direction of the revision depends very much on the region, although the ZHVI year-over-year change is typically revised downward for areas that have experienced high price appreciation. For example, the November year-over-year change for Phoenix has been revised downward from 19.4% to 15.0%. In addition to revisions due to the more accurate valuation method and improved transaction filtering, the new approach to correcting residual systematic error also contributes somewhat to the restatement of the index levels.
The November ZHVI release incorporated the latest version of the home valuation model, which is the model that produces the Zestimate® home value. This latest version resulted in a significant increase in the accuracy of the Zestimate (which is 13% more accurate than a year ago). Accuracy was especially improved for high-end homes (30% improvement), waterfront homes and homes in less urban areas. The new valuation model resulted in moderate revisions to the national ZHVI, resulting in a small increase to the overall level of the ZHVI and somewhat decreased peak-to-trough cycles.
The November ZHVI also took advantage of improved filtering on transactional data. This change impacts the ZHVI indirectly through a corresponding improvement in the valuation model (see above) and more directly through more accurate correction for residual systematic error. The valuation algorithm and the ZHVI exclude transactions that are not representative of what is considered a full-value, arms-length transaction between a buyer and a seller. This definition excludes transactions such as foreclosures, foreclosure re-sales, estate sales and intra-family transfers. In doing a better job of identifying these transactions, the ZHVI has increased on a national basis as well as in many regions. For example, the current ZHVI for Sacramento is $300,000 under the revised methodology versus $284,500 under the previous methodology, a 5.4% increase in level.
While the errors produced by the Zestimate algorithm are generally equally distributed above and below the actual sale price, in cases of rapid home value change, there can be some residual systematic error detected once more historical sales are known (systematic error here is defined as the median raw error being slightly greater or less than zero). In this event, raw median Zestimates used for index construction are adjusted using a model based on any residual systematic error associated with Zestimates themselves.
![]()
The systematic error correction is based on comparing the transactions versus the Zestimate for a time period. Since transactions are relatively sparse, particularly in smaller geographic regions, the new systematic error correction method smooths the bias over time and shrinks the estimate towards zero. The smoothing procedure is based on fitting a natural cubic spline with knots evenly spaced every twelve months. Specifically, the smoothed value is given by the predicted value from the model.
For regions with fewer than 100 transactions in a time period, the resulting smoothed estimate of bias will be shrunk towards zero.
For additional inquiries, contact Zillow Research here.
