Executive summary
- Over the next year, the underlying drivers of the housing market will approach a delicate handoff as a market driven by accommodative monetary policy gives way to one driven by macroeconomic fundamentals.
- In this analysis, we estimate a model of Existing Home Sales to assess the contributions of monetary policy versus macroeconomic fundamentals to housing market activity: Under the median scenario, home sales are projected to fall slightly from their current level over the next year.
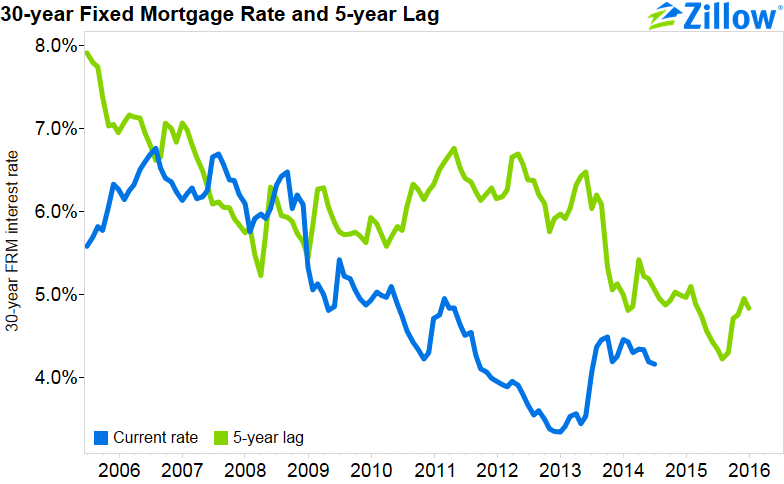
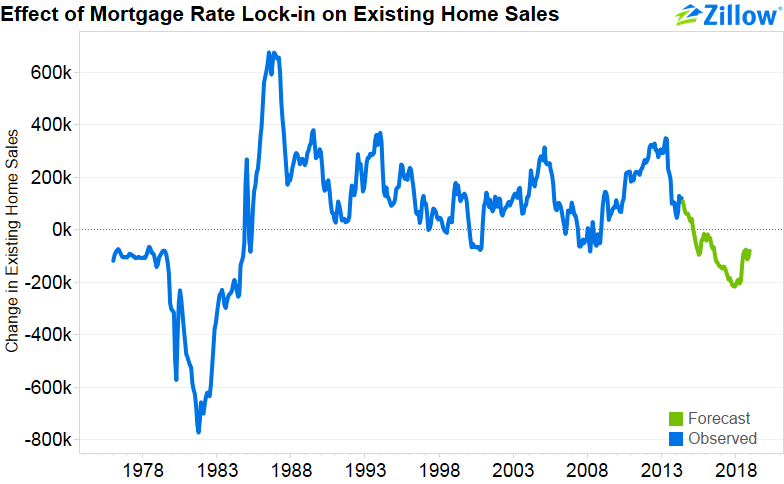
- As rates eventually rise above their five-year-earlier values, some homeowners may become reluctant to move as doing so would require them to assume a new mortgage at a higher interest rate—a phenomenon known as “mortgage rate lock-in.” This effect will become particularly prominent moving beyond fall 2015.
- It is not clear that fundamentals will improve sufficiently strongly or rapidly to offset the expected rise in interest rates: If rates remain at their current levels, household income would have to grow by 4.2 percent over the next year, above its historic average of 3.9 percent.
Introduction
Existing home sales have recovered slowly and have struggled to gain momentum over the past half-decade as the United States economy emerges from the Great Recession. Countervailing economic currents have pushed existing home sales in opposite directions. Low and declining interest rates—the result of extraordinary monetary policy actions—have been broadly supportive of home sales, but broader economic trends—including low homeownership and household formation, high unemployment and slow income growth—have been a net drag on home sales.
However, the economic forces driving existing home sales are in flux. The Federal Reserve has embarked on a gradual retreat from its accommodative monetary policies of recent years, starting with an incremental reduction in the pace of monthly purchases of government and mortgage-backed securities initiated in December 2013, and interest rates have climbed from their historic lows. These decisions were made in response to the expectation that economic growth and inflation are poised to strengthen in the near-term—contributing to higher wage growth, faster household formation, and eventually, to higher homeownership rates.
The looming handoff—as the underlying economic motor of home sales shifts from accommodative monetary policy toward more traditional macroeconomic fundamentals—is contributing to considerable uncertainty in housing markets. In particular, as the cyclical boost to home sales from low interest rates wanes, it is not obvious that income growth and household formation will pick up sufficiently (or sufficiently quickly) to offset the drag from monetary policy.
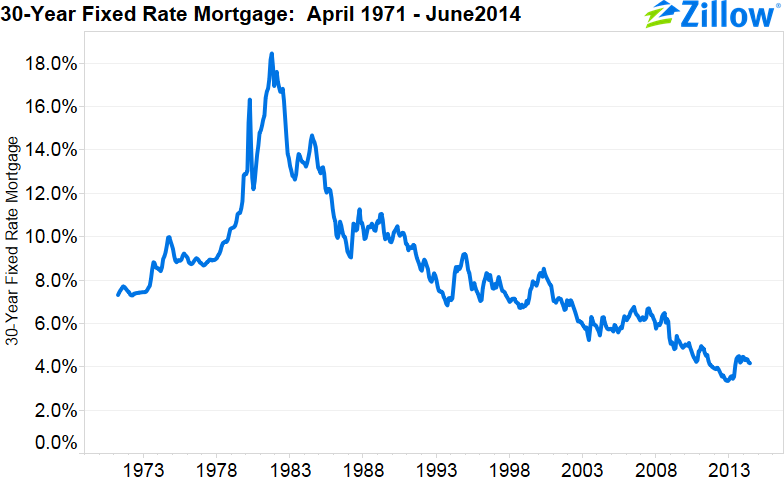
As monetary policy begins to tighten and interest rates eventually rise, there is a sense that the U.S. housing market is on the cusp of a historic shift. After increasing from the 1950s through the 1970s, interest rates have moved seemingly continuously downward since the 1980s, with only the occasional and brief period of rising rates (chart below). A generation of home buyers has grown accustomed to being able to increase their housing consumption (or refinance their current home) without meaningfully increasing their housing costs. But after a half-decade during which risk-free rates have approached zero, interest rates have nowhere to go but up. As homeowners confront this new reality, there is a growing concern that some, particularly those who obtained fixed-rate mortgage loans during a period of historically low interest rates, will be reluctant to move as interest rates rise, since doing so would require them to assume a new mortgage at a higher interest rate—a phenomenon commonly referred to as “mortgage rate lock-in.”
In this analysis, we estimate a model of existing home sales in order to disentangle the drivers of sales in recent years. We then assess the contribution of several key economic variables to the current low level of existing home sales, and estimate how sales might evolve as interest rates continue to rise.
The model
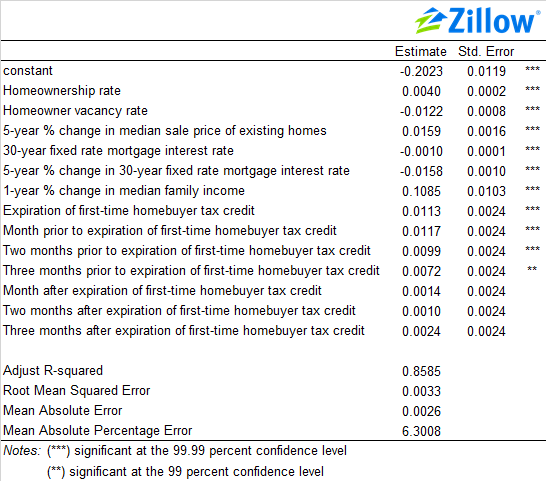
To estimate existing home sales, we first estimate housing turnover, defined as the quotient of existing home sales and the number of households. Housing turnover is modeled as a function of several variables, listed below with data sources adjacent italicized in parentheses. The data cover the period from April 1976 through May 2014.
- The seasonally-adjusted homeownership rate (U.S. Census Bureau, Current Population Survey/Housing Vacancy Survey);
- The seasonally-adjusted homeowner vacancy rate (U.S. Census Bureau, Current Population Survey/Housing Vacancy Survey)[1];
- The five-year percent change in the median seasonally-adjusted sales price of existing single-family homes (National Association of Realtors/Moody’s Analytics);
- The average 30-year conventional fixed rate mortgage interest rate, not seasonally adjusted (Freddie Mac, Primary Mortgage Market Survey);
- The five-year percent change in the average 30-year conventional fixed rate mortgage interest rate (not seasonally adjusted), which captures the effect of mortgage rate lock-in (Freddie Mac, Primary Mortgage Market Survey);
- The one-year percent change in the seasonally-adjusted median family income (U.S. Census Bureau, Decennial Census, Current Population Survey and American Community Survey interpolated by Moody’s Analytics); and
- A series of dummy variables indicating whether the current month coincided with the expiration of federal first-time homebuyer tax credits (October 2009 and May 2010), or with the three prior to or following the expiration of the tax credits.
Several adjustments to the data were necessary. First, data on existing home sales for single-family residences, condos and co-ops are available only through January 1999. A longer historical data series on existing home sales for only single-family residences is available, and we used changes in the longer series (excluding condos and co-ops) to extend back the more comprehensive but shorter series on existing home sales (including condos and co-ops). Second, quarterly data are interpolated into monthly series by Moody’s Analytics. In addition, we seasonally adjusted the homeownership and household vacancy rates from ACS/HVS using conventional seasonal adjustment techniques.
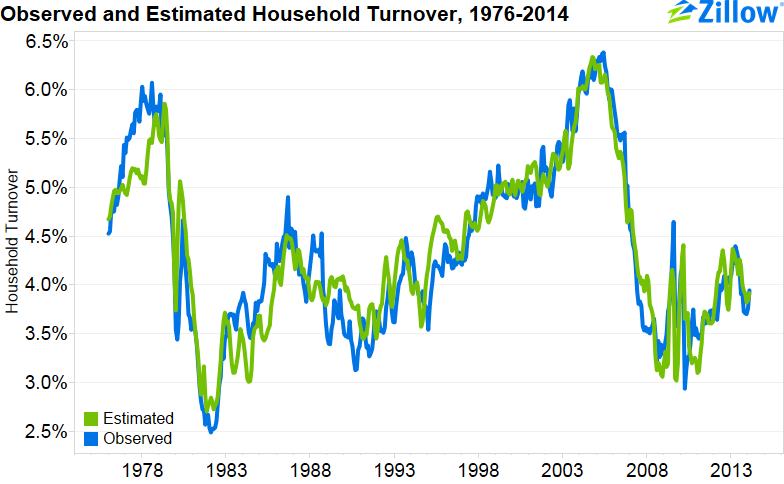
The two charts below show the results of this model and compare the model estimate of housing turnover, with the observed value, over the sample period. All of the explanatory variables, with the exception of the indicators for the three months following the expiration of the new home-buyer tax credits, are strongly statistically significant and the model explains about 86 percent of the turnover rate.
What is currently constraining sales?
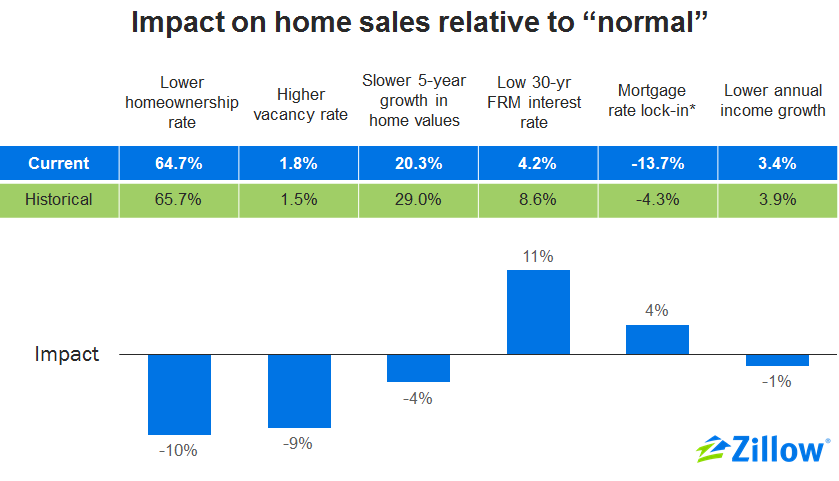
Next, we use the model of household turnover estimated in the previous section to assess the forces currently driving existing home sales as of May 2014. Compared to historical trends, household formation is weak, the homeownership rate is low, vacancies are high, and income growth is weak. By contrast, mortgage rates are low relative to historical levels, but higher than a year ago.
As the chart below illustrates, holding all else equal, historically low interest rates have boosted existing home sales by a total of about 15 percent – mostly directly but also indirectly by making it more attractive for mortgage holders to move or refinance at a lower interest rate. However, the boost has not been sufficient to overcome the drag from other factors, which have held existing home sales below their historical average.
How can sales be expected to evolve over the next year?
In this section, we use the model described in the previous section, projections from the 2014-Q2 Zillow Home Price Expectations Survey and the Mortgage Bankers Association’s most recent Mortgage Finance Forecast to estimate how existing home sales might evolve over the next year.[2] We estimate point forecasts for six months ahead (end of 2014) and 12 months ahead (mid-2015). The table below shows the sources and assumptions underlying the forecasts.
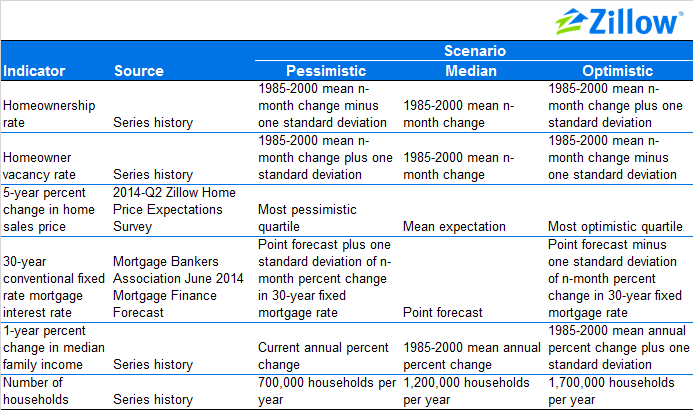
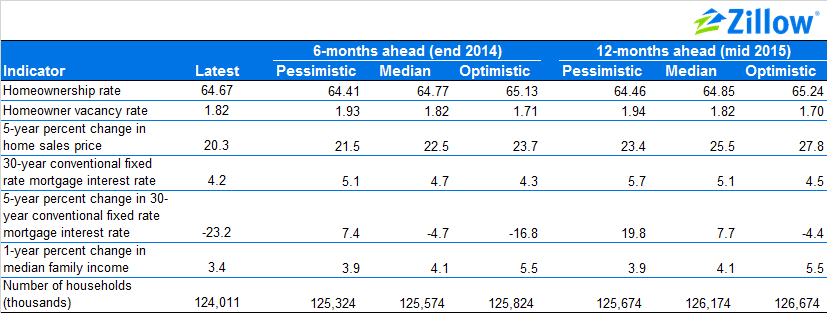
In the case of the MBA Mortgage Finance Forecast, we use the 2014-Q4 forecast for the six-month-ahead estimates and the 2015-Q2 forecast for the 12-month-ahead forecast. The remaining forecasts are monthly series. The results of these forecasts of inputs to our model of existing home sales are presented in the table below.
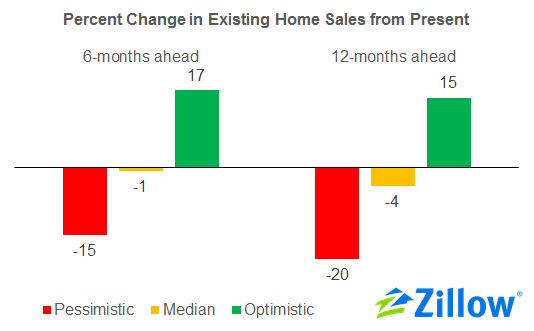
As illustrated in the chart below, under the median scenario described above, existing home sales are projected to fall slightly from their current level by 1 percent over six months and by 4 percent over 12 months. Under the pessimistic scenario described above, existing home sales could fall by as much as 15 percent by the end of 2014 and by 20 percent through the end of 2015. However, under more optimistic assumptions, existing home sales would rise from their current levels by 17 percent over six months and by 15 percent over the year.
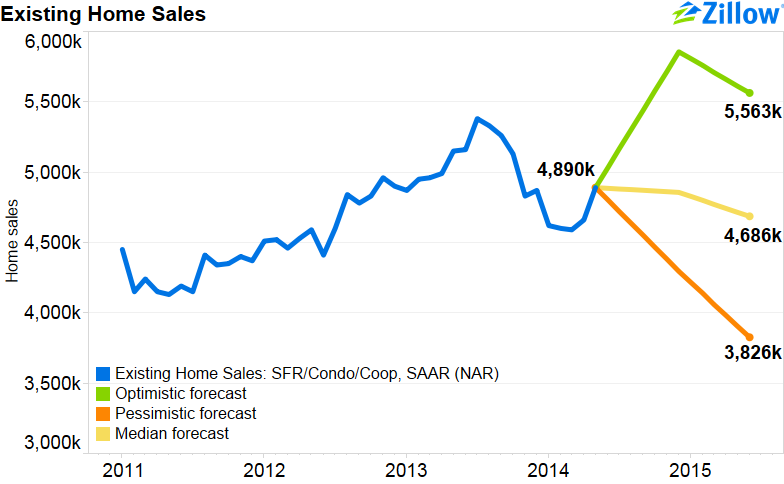
The broad range of outcomes projected by the model suggest that existing home sales are very likely to fall in the months ahead, even while existing home sales have increased strongly earlier this year. As the chart below illustrates, under the median scenario, existing home sales would essentially be flat over the next year. Under the pessimistic scenario, they would fall to levels comparable to levels observed during the worst months of the recession.
Risks and challenges moving forward
The analysis above suggests that as the underlying drivers of existing home sales shift from accommodative interest rates to more traditional fundamentals such as economic growth and household formation, the timing of the handoff is likely to be imperfect. Two competing perspectives on the monetary policy outlook hold broad implications for the trajectory of existing home sales.
In one view, interest rates will rise more rapidly than expected as the Fed withdraws from asset purchases, particularly since the Fed has been such a large portion of aggregate demand for Treasury and mortgage-backed securities in recent months. In this view, the Fed’s verbal commitments to maintain low interest rates for a protracted period of time will not prove credible, the jump in interest rates will hold back existing home sales, and mortgage rate lock-in will become an increasingly prominent challenge for housing markets. This view corresponds roughly to the pessimistic scenario described in the previous section.
In a second view, interest rates will remain lower for a longer period of time than expected due to a structural shift in the equilibrium level of demand for credit (a perspective often labeled “secular stagnation”). If this viewpoint proves accurate, the historic relationship between interest rates and output will no longer hold and other variables would have to compensate as the stimulus from low interest rates wanes. This view corresponds roughly to the optimistic scenario described in the previous section.
Below, we discuss the implications of these two perspectives for existing home sales.
Mortgage rate lock in will be increasingly important
Understanding the effect of mortgage rate lock-in moving forward, specified in the model by the five-year change in the 30-year fixed rate mortgage, is particularly important at this juncture since five years ago coincides with the Federal Reserve Board’s first round of Quantitative Easing (QE1). At that time, mortgage rates had declined from the fall of 2008 through the spring of 2009, as the Fed lowered its benchmark interest rate and began its first round of asset purchases. For much of the period between January 2009 and May 2010—roughly corresponding to the duration of QE1—the 30-year fixed mortgage rate hovered around 5 percent (with the exception of summer 2009 when rates temporarily increased in response to strong economic data and short-lived expectations that the Fed would raise rates).
Looking forward from the present, mortgage rates will have to remain below levels that prevailed in late 2009 and early 2010 (about 5 percent) over the next year in order to continue being a modest boost to existing home sales—an outcome that is not farfetched (see figure below). However, after summer 2010, rates began a long decline as the Fed dramatically expanded its asset purchases, eventually bottoming out at 3.3 percent in December 2012. This means that even if rates remain at their current levels around 4.5 percent—an extremely optimistic and unlikely scenario—they will begin to be a drag on existing home sales as soon as fall 2015 when the five-year change will turn positive. As the second figure below shows, this will translate into nearly 100,000 fewer existing homes sold by mid-2015. Moving further into the future, if interest rates remain at their current levels, this would translate into more than 200,000 fewer existing home sales by late 2017.
In the longer term, the broader housing market challenges associated with a rising interest rate environment are not well understood, particularly by consumers—mortgage rates have exceeded their five-year-earlier value only 10 percent of the time since 1985—most recently briefly between June 2007 and November 2008 and between February and November 2000. Between January 1985 and December 1999, mortgage rates were above their five-year earlier value in only seven of 180 months.
Past relationships might not hold in the future
Some studies suggest that there has been a structural shift in the equilibrium level of demand for credit and that, as a result, the interest rate corresponding to an economy operating at full capacity has shifted downward.
If interest rates and other variables remain at their current levels, median household income would have to grow by 4.2 percent over the year ending in June 2015 for existing home sales to remain at their current level—well above its historic average of 3.9 percent. That level of median family income growth would correspond to Personal Consumption Expenditure (PCE) growth of 2.6 percent, beyond the upper end of the Fed’s range of projections for 2015 (2.4 percent). Moving forward six months to the end of 2015, the five-year change in interest rates would fall to zero and median family income would have to grow by 4.8 percent over the year, which would correspond to annual PCE growth of 2.9 percent. Given the Fed’s current commitment to a PCE target of 2.0 percent, it is difficult to imagine that the Fed would tolerate this rate of PCE growth without raising the Federal Funds Rate.
While the “lower for longer” rates assumed under this scenario would be better for home sales since the five-year interest rate differential associated with mortgage rate lock-in would remain negative (i.e., rates would continue to be near or below their five-year earlier value), low rates would likely be associated with slower income growth, itself a drag on home sales.
Conclusion
Overall, over the next year, the underlying drivers of housing markets will experience a delicate handoff. As the recession-era stimulus from low interest rates wanes—and eventually becomes a headwind—many hope that the historic drivers of existing home sales—such as income growth and household formation—will recover sufficiently quickly and sufficiently robustly to compensate. However, historic experience suggests that this outcome will be difficult to achieve.
[1] The homeowner vacancy rate is the proportion of homeowner inventory which is vacant and for sale.
[2] Mortgage Bankers Association, Mortgage Finance Forecast, June 19, 2014. For the results of the most recent Zillow Home Price Expectations Survey, see Meredith Miller, “Experts Predict Home Value Gains Through 2018, Weigh In On Affordability,” Zillow Real Estate Research, June 30, 2014.
