Zillow expects existing home sales for September to rise as much as 2.1 percent in the number of sales in September, to a seasonally adjusted annual rate (SAAR) of 5.15 million units, up from 5.05 million units in August. But the models we use and their underlying assumptions are not always as definitive as we would like. Here is more of the thinking behind our assumptions and how they impact our forecast.
Zillow’s existing home sales forecast uses two models:
- A “structural” model that estimates home sales as a function of other economic data. More information about this model can be found here.
- A “historical” model that estimates home sales as a function of past movements in existing home sales as well as recent pending home sales data. More information about this model can be found here.
The historical model considers past values of pending and existing home sales when estimating existing home sales for the current month. When pending home sales increase, existing home sales tend to rise during the subsequent four months. But when existing home sales increase in one month, they are expected to decline during the next two months.
For September, the expected increase in existing home sales is the result of the combination of a strong increase in pending home sales in July and weak existing home sales in August. Both data points suggest strong existing home sales in September.
The structural model typically provides greater insight than the historical model into the broader economic forces that drive existing home sales. But depending on the month, it can rely heavily on forecasts of explanatory variables. In September, the homeownership rate and homeowner vacancy rate appear to be the most important factors influencing existing home sales, although it’s important to note that both series are forecasts.
We assume that the homeowner vacancy rate increased modestly over the summer, from 1.63 to 1.69, reversing its recent decline. After rising sharply during the recession, the vacancy rate has since recovered to near pre-crisis levels. But as the housing recovery slows and markets normalize, the homeowner vacancy rate could pick up slightly. Since the homeowner vacancy rate has a relatively large effect in our model, our forecast of existing home sales is particularly sensitive to this assumption.
The baseline model also assumes that the homeownership rate increased only modestly—from 64.8 percent in June to 64.9 percent in September. The homeownership rate has been falling steadily since the peak of the housing bubble – the April homeownership rate of 64.6 percent was the lowest rate observed in almost 20 years. Less people entering homeownership has, naturally, put a damper on the overall volume of home sales during the past few years.
But if we assume that homeowner vacancy and homeownership rates both moved in more favorable directions, our forecast of existing home sales gets stronger.
Assuming that the homeowner vacancy rate continued declining to 1.55, and assuming that the homeownership rate increased more dramatically over the summer to 65.3 percent, then existing home sales would jump to 5.33 million units (SAAR) in September, up 5.6 percent from August. If only one of the underlying forecasts improves, then existing home sales would total between 5.15 million units (SAAR) and 5.16 million units (SAAR), up between 1.9 percent and 2.1 percent from August and in line with the results of our historical model.
Finally, interest rates were essentially flat in September, averaging 4.16 percent for a 30-year, fixed-rate mortgage, exactly where they stood in June. This is continuing to provide a modest, if waning, boost to home sales. The gap relative to historical rates was virtually unchanged.
Forecast Risks
Homeowner Vacancy Rate
 There is uncertainty surrounding the path of the homeowner vacancy rate. Although the series has trended downward, there have been considerable jumps.
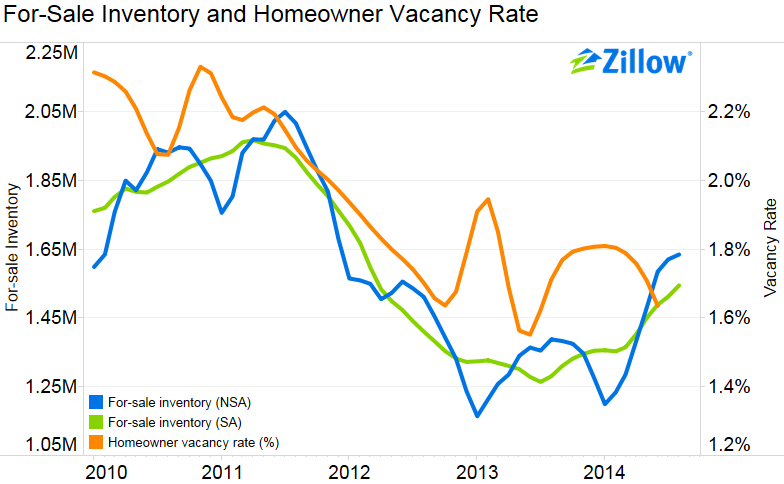
To index the homeowner vacancy rate forward from June 2014, we used Zillow’s unadjusted for-sale inventory series. Between January 2010 and August 2014, the two series have a correlation of 0.7697.[1] Inventory data are available only through August 2014, so we hold this most recent estimate as constant for September.
Using this assumption, which is included in our baseline model, we expect the homeowner vacancy rate to reverse its recent decline and increase to 1.69 in September, up from 1.63 in June. This would be consistent with a cooling national housing market that has been signaled by other recent data.
But if the homeowner vacancy rate continues to fall and reaches 1.55 in September—the same rate as its recent low, recorded in June 2013 before interest rates began to rise—then our baseline forecast of September 2014 existing home sales would increase to 5.15 million units (SAAR), in line with the results of the historical model.
Homeownership Rate
The homeownership rate has proven particularly difficult to forecast in recent years. After consistently rising between 1995 and 2005, it has since trended downward. Additionally, seasonal patterns have shifted, complicating seasonal adjustment of the series and making it especially difficult to distinguish between seasonal and non-seasonal movements (our existing home sales model relies on the non-seasonally adjusted series).
We test two scenarios for the path of the homeownership rate.
In our baseline model, we assume that the homeownership rate moves in line with the change in existing home sales two months earlier. Looking over the past 18 months, there is a strong 0.9584 correlation between the homeownership rate and a second-order lag of existing home sales.[2] Indexing the homeownership rate forward yields an estimated homeownership rate of 64.9 percent in September 2014—essentially unchanged from the 64.8 percent rate in June.
In the second scenario, we find a best-fit ARIMA function for the homeownership series using data from December 2004 (when the homeownership rate peaked) onward—an ARIMA(2,1,4) model in this case. By truncating the series, we are better able to capture this recent trend. This assumption produces an estimated homeownership rate of 65.3 percent in September, 0.5 percentage point higher than the June rate. This more optimistic assumption about the homeownership rate would increase our baseline forecast of September 2014 existing home sales to 5.16 million units (SAAR), up 2.1 percent from August and slightly above the forecast from our “historical” model.
Median Family Income
Another risk to our estimate of existing home sales concerns the rate of change of median family income in recent months, a key input in our fundamentals model. Since data on median family income are currently only available through March 2014, we also must extrapolate forward, similar to vacancy and homeownership rates.
We use the Consumer Price Index (CPI) for services to index median family incomes forward from March 2014, the most recent data available. Recent research suggests that services inflation is a strong predictor of income growth.[3] The correlation between the service CPI and median family income is 0.9899 for the post-recession period, compared to a correlation of 0.9344 for headline CPI. However, CPI data are currently available only through August 2014. So additional assumptions are necessary to move the median family income series forward through September.
One option is to directly use the median family income indexed through August 2014 by the services CPI and assume a constant annual growth rate into September. Under this assumption, median family incomes would have grown by 3.0 percent in September 2014 relative to a year earlier.
Another option is consider a lag of the services CPI. Over the post-recession period, median family incomes also have a very strong correlation with a one-month lag of the services CPI—0.9916, higher than the contemporaneous correlation. If we assume that median family incomes grew in line with the services CPI in the prior month, then median family incomes would have grown 3.2 percent year-over-year in September.
Given the stronger correlation between median family incomes and a one-month lag of services CPI, we use this assumption as our baseline scenario. However, if family incomes increase more modestly—in line with the contemporaneous correlation with services CPI—then our baseline forecast for September 2014 existing home sales would fall further, to 4.95 million units (SAAR), down 1.9 percent from August.
Other Assumptions
Other assumptions have smaller effects on the estimates produced by our fundamentals model.
For the median sales price of existing homes, we forecast the series one-month ahead using a best-fit ARIMA model estimated over the period beginning in April 1976 through July 2014—an ARIMA(2,1,3) process in this instance. This produces an estimated median sales price for existing homes in September 2014 of $212,518, up 0.8 percent from $210,784 in August.
Finally, we forecast the number of households three-months ahead using a best-fit ARIMA model, estimated over the period April 1976 through June 2014, an ARIMA(0,2,1) process in this case. This produces an estimate of 115.29 million households in September 2014, up 0.2 percent from 115.097 million in June.
Given the relatively small coefficients associated with these variables in our model, we believe that these assumptions are reasonable and conservative.
[1] The correlation has weakened in recent months with the two series moving in opposite directions since January 2014.
[2] Over the histories of the series, there is a more modest 0.6508 correlation between the homeownership rate and a two-month lag of existing home sales.
[3] Edward S. Knotek II, and Todd E. Clark, “Inflation: Why It Is Very Low, and Why It Matters,” Federal Reserve Bank of Cleveland, Annual Report 2013.
