Live, Work and Play: Where to Maximize Take-Home Pay and Job Opportunities
Where we live has an enormous influence on how we balance the competing demands of living, working and playing. We all (well, most of us) need to work, and communities with stronger labor markets widen our options. We all need a place to live, too, but housing is more costly in some places than in others. And our capacity for play comes out of everything left over from the fruits of our labor after taxes and housing costs – the price we pay to live in a civilized society.
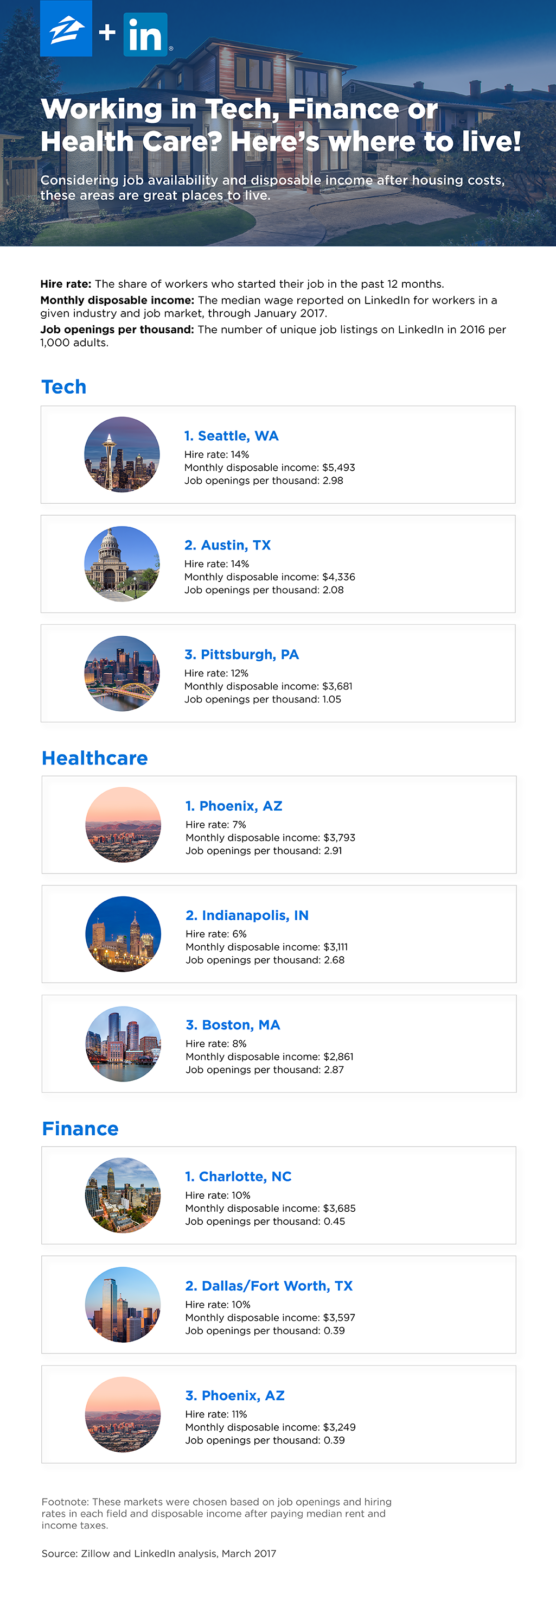
- For tech workers, Austin, Pittsburgh and Seattle offer the best balance between housing costs, income and job opportunity.
- For healthcare workers, Boston, Indianapolis and Phoenix offer the best potential for living, working and playing.
- Charlotte, Dallas and Boston rank highly for finance workers seeking to maximize take-home pay and land a good job.
 Where we live has an enormous influence on how we balance the competing demands of living, working and playing. We all (well, most of us) need to work, and communities with stronger labor markets widen our options. We all need a place to live, too, but housing is more costly in some places than in others. And our capacity for play comes out of everything left over from the fruits of our labor after taxes and housing costs – the price we pay to live in a civilized society.
By combining data from LinkedIn on local labor markets and incomes across 30 metro markets with Zillow data on housing costs, we identified those areas offering the most potential for both landing a good job and taking home the biggest chunk of salary possible after taxes and housing. We focused on three growing, white-collar industries – finance, tech, and healthcare – and ranked markets for both renters and homeowners, taking into consideration:
- The velocity of the labor market in each industry – in other words, the share of workers who have been hired in the past year.
- The number of job openings in a given industry (per 1,000 adults).
- The share of income a worker can expect to keep after housing costs and taxes.
For tech workers, Austin, Pittsburgh and Seattle trade places for the top three rankings depending if the worker is a renter or homeowner. For healthcare workers, Boston, Indianapolis and Phoenix rank among the top three for both owners and renters. For finance industry workers, Charlotte and Dallas-Fort Worth are consistently in the top three while Phoenix displaces Chicago as an attractive market for renters as opposed to owners.
Use the tool at the bottom of this post to explore the interplay between housing costs, job opportunities and disposable income for tech, health care and finance workers in various markets nationwide.
Methodology
Using their proprietary data, LinkedIn computed three labor-market metrics for each of the three industries and each metro analyzed:
- The hire rate: The number of professionals on LinkedIn who indicated a job change in 2016, relative to the total number of professionals on LinkedIn;
- The number of job openings: The number of available LinkedIn jobs, per one thousand LinkedIn members; and
- The median wage reported on LinkedIn for workers in a given industry and metro, through January 2017.
We scaled the number of job openings by the adult population of a given metro according to the U.S. Census Bureau’s 2011-2015 American Community Survey.
To compute after-tax incomes, we took median 2016 incomes reported by LinkedIn and subtracted federal and state income taxes and median monthly housing cost as of December 2016 according to Zillow data. For homeowners, we assumed a monthly mortgage payment is equal to the mortgage payment associated with a 30-year, fixed rate loan at a 4 percent interest rate with a 20 percent down payment on the median-valued home in a given region. For renters, we assume they pay the median rent in their metro area.
We then estimated and subtracted federal and state (where applicable) income taxes, assuming a single-earner with no dependents taking the standard deduction. Data on federal tax rates are from the Internal Revenue Service, and state tax income tax rates are reported by the Tax Foundation.
Median home values and rents reported correspond to LinkedIn’s custom metro regions and differ slightly from the standard median home values and rents for metro areas typically reported by Zillow.

