November Market Report: How Much Would It Cost to Buy Every Home in America?
Got a spare $28.4 trillion lying around? If so, and if you’re looking for a decent investment opportunity, you could – at least theoretically – purchase every home in the United States.
- The total cumulative value of every U.S. home is expected to top $28.4 trillion at the end of 2015, up 4.1 percent year-over-year.
- In November, the median U.S. home was worth $183,000, according to the Zillow Home Value Index, up 0.3 percent from October and 3.9 percent from November 2014.
- The median U.S. rent was $1,382 per month in November, according to the Zillow Rent Index, up 0.1 percent from October and 3.8 percent from a year ago.
Got a spare $28.4 trillion lying around? If so, and if you’re looking for a decent investment opportunity, you could – at least theoretically – purchase every home in the United States.
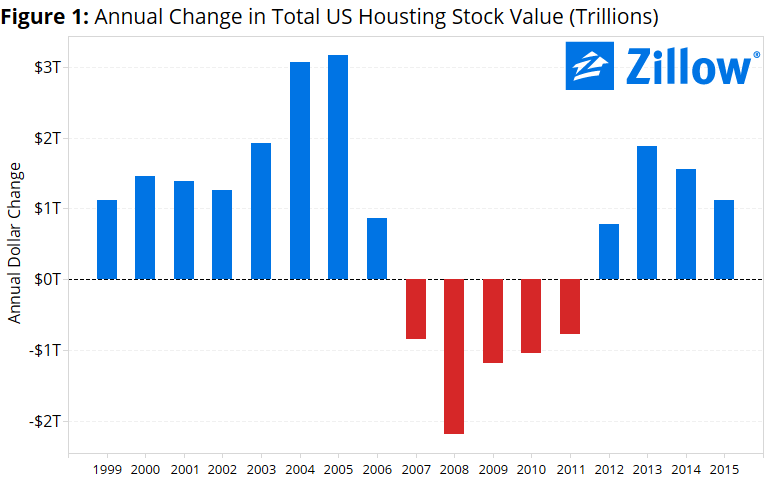 The estimated, total cumulative value of every U.S. home as of the end of 2015 is expected to top $28.4 trillion, up 4.1 percent ($1.1 trillion) from the end of 2014 (figure 1). Put another way, the total value of the entire United States housing stock is more than the combined gross domestic products of the United States and China, by far the world’s two largest national economies. It is also in line with what the market capitalization of every domestically listed company!
Clearly, there’s value in real estate.
But while that $28.4 trillion figure may sound enormous – and it is – the effects of the housing recession still loom large over the market. Just as the median value of an individual U.S. home remains 6.7 percent off from its pre-recession peak, the cumulative value of all U.S. homes is also still not as high as it once was. The total cumulative value of the U.S. housing stock peaked at the end of 2006, at more than $29.2 trillion.
At its core, the United States housing market is really just a collection of smaller, local markets. And the value of the housing stock in a few of the country’s larger, individual metro markets alone is enough eclipse the total GDP of several prominent nations.
The housing stock in the Los Angeles metro – including Malibu and Beverly Hills, among other super-pricey housing markets – is worth an estimated $2.4 trillion on its own, more than the GDP of Brazil, host of the 2016 summer Olympic Games. The New York metro’s total housing stock is worth an estimated $2.3 trillion, more than the entire economic output of Italy. In third place among large U.S. metros, the total value of the San Francisco-area housing stock is more than $1.2 trillion – roughly equivalent to the GDP of Mexico.
And a number of large markets are also bucking the national trend as local home value growth outpaces the nation as a whole. While the overall U.S. housing stock’s value remains down from pre-recession peaks, the cumulative housing value in 13 of the nation’s 35 largest markets is as high as it has ever been. But what goes up, must also come down – at least in some markets. The cumulative housing stock value fell year-over-year in 2015 in two of the nation’s largest markets, Baltimore ($274.2 billion cumulative value, down 0.7 percent from 2014) and Washington, D.C. ($939.3 billion, down 0.3 percent from 2014).
And let’s not forget America’s 43 million renter households. Approximately $535 billion was spent on rent nationwide in 2015, roughly comparable to the total budget of the U.S. Department of Defense (about $575 billion). The total spent on rent this year was up $19 billion, or 4 percent, from $516 billion in 2014.
Home Value Growth: Steady as it Goes
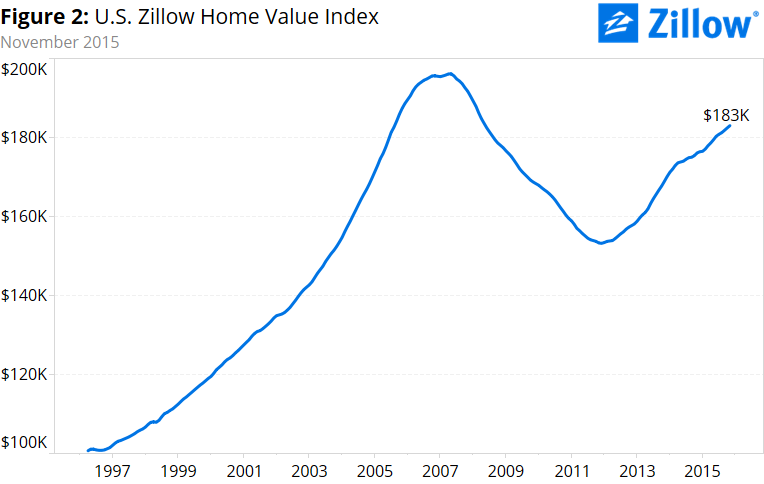 In November, the median U.S. home was worth $183,000, according to the Zillow Home Value Index, up 0.3 percent from October and 3.9 percent from November 2014 (figure 2). Both the monthly and annual growth rates were little changed from prior months, an indicator of continued stability in the overall national market.
Home values in 26 of the nation’s 35 largest metro markets grew faster year-over-year than the nation’s 3.9 percent annual pace. Home values grew by more than 10 percent per year in six of those large metro markets: Denver (up 15.5 percent year-over-year), Dallas (14.4 percent), San Francisco (12.7 percent), San Jose (12.7 percent), Portland (11.5 percent) and Miami (10.8 percent). None of the nation’s largest metros experienced annual home value declines in November, though median home values in Baltimore were flat year-over-year.
Rental Growth Continues to Cool
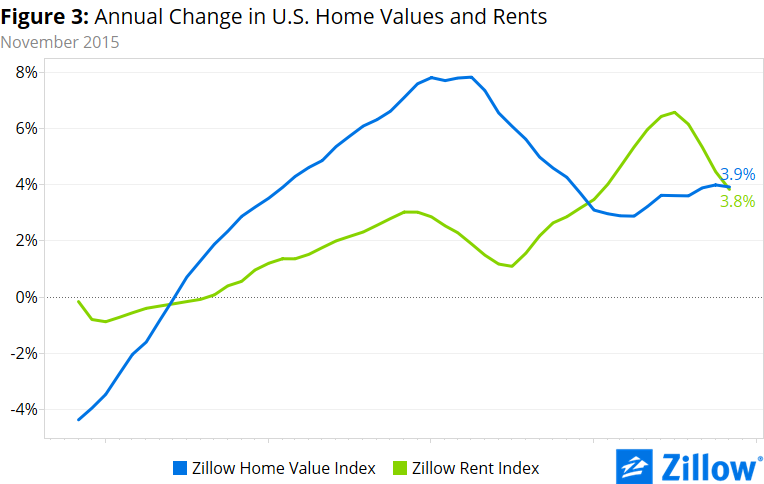 The median U.S. rent was $1,382 per month in November, according to the Zillow Rent Index, up 0.1 percent from October and 3.8 percent from a year ago (figure 3). While still growing at a healthy clip, the annual pace of rental growth has slowed considerably in recent months. After reaching a 2015 peak pace of 6.6 percent per year in July, annual rental growth has fallen in each of the past four months compared to the month prior.
Which isn’t to say there aren’t areas where the rental market remains incredibly hot. Median rents grew in excess of 10 percent annually in both the San Francisco (up 13.8 percent year-over-year, to $3,325 per month) and Portland (up 10.3 percent, to $1,683/month) metro areas.
Annual rental growth in Denver and San Jose (both up 9.7 percent from November 2014) wasn’t far behind. Among the country’s 35 largest metros, none experienced annual declines in rent, but rents fell month-over-month in 15, and were flat from October in another four.
Inventory Still Tight
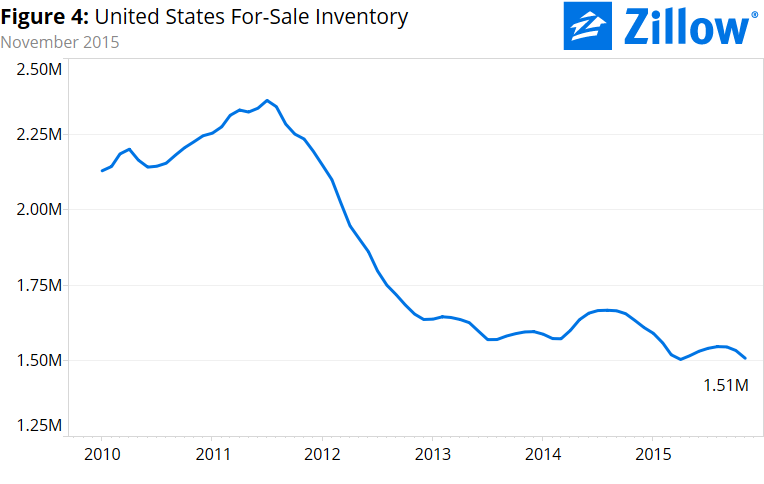 Seasonally adjusted, the number of homes for-sale nationwide in November fell 1.7 percent from October and 7.6 percent from a year ago (figure 4). November’s annual decline in inventory marked the 10th straight month of year-over-year inventory declines, after a brief period throughout much of the second half of 2014 and into 2015 in which inventory was climbing on an annual basis.
Of the nation’s largest 35 metro markets, San Diego (down 31.3 percent year-over-year), Charlotte (down 29.5 percent) and Seattle (down 29.2 percent) experienced the biggest decreases in inventory over the past year. Atlanta (up 17 percent), Austin (up 12.1 percent) and Washington, D.C. (up 10.6 percent) experienced the biggest year-over-year gains in homes for sale.
Outlook
Looking ahead into 2016, a number of trends are expected to shape the for-sale and rental markets:
- The median age of first-time buyers will reach new highs in 2016 as millennials put off homeownership and other major life decisions.
- Growth in home values will outpace incomes, especially for low-income Americans. In 2016, those whose incomes fall in the bottom third of all incomes will likely be priced out of homeownership and unable to afford even the least expensive homes on the market.
- Growth in rents may be slowing, but rents will still grow in 2016, likely bringing the least affordable median rents ever.
- And as affordable housing close to city centers grows increasingly scarce, people will move farther out. Dense, walkable suburbs with an urban feel – especially those that offer good access to the city – will be 2016’s new hot spots.

