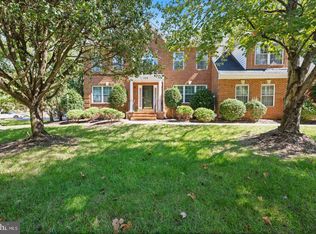
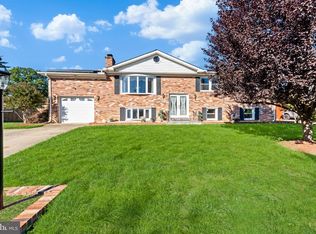
$494,500
5 bd3 ba3.5k sqft
19 Notley Rd, Fort Washington, MD 20744
Off Market

Likely to sell faster than
Zillow last checked:
Listing updated:
Evan Weissman 410-240-2922,
EXP Realty, LLC 8888607369

$501,800
$477,000 - $527,000
$4,451/mo
| Date | Event | Price |
|---|---|---|
| 10/23/2026 | Listed for sale | $500,000$134/sqft |
Source:  Bright MLS #MDPG2222730 Report a problem | ||
| 10/22/2026 | Contingent | $500,000-50%$134/sqft |
Source: Bright MLS #MDPG2222730 Report a problem | ||
| 10/16/2026 | Listed for sale | $1,000,000+127.8%$269/sqft |
Source: Bright MLS #MDPG2222730 Report a problem | ||
| 7/13/2011 | Sold | $439,000$118/sqft |
Source: Public Record Report a problem | ||
| 4/3/2011 | Listing removed | $439,000$118/sqft |
Source: RE/MAX SPECIALISTS #PG7269573 Report a problem | ||
| 3/17/2011 | Price change | $439,000-3.7%$118/sqft |
Source: RE/MAX SPECIALISTS #PG7269573 Report a problem | ||
| 3/4/2011 | Price change | $455,900+3.8%$123/sqft |
Source: RE/MAX SPECIALISTS #PG7269573 Report a problem | ||
| 2/26/2011 | Price change | $439,000-3.7%$118/sqft |
Source: RE/MAX Specialists #PG7269573 Report a problem | ||
| 9/30/2010 | Price change | $455,900+1.3%$123/sqft |
Source: RE/MAX Specialists #PG7269573 Report a problem | ||
| 7/1/2010 | Price change | $450,000-6.3%$121/sqft |
Source: RE/MAX Specialists #PG7269573 Report a problem | ||
| 5/14/2010 | Price change | $480,500-3.9%$129/sqft |
Source: RE/MAX Specialists #PG7269573 Report a problem | ||
| 3/9/2010 | Listed for sale | $499,999+136.8%$134/sqft |
Source: RE/MAX Specialists #PG7269573 Report a problem | ||
| 11/1/2009 | Listing removed | $211,112$57/sqft |
Source: foreclosure.com Report a problem | ||
| 10/26/2009 | Listed for sale | $211,112-12%$57/sqft |
Source: foreclosure.com Report a problem | ||
| 4/30/2009 | Listing removed | $239,900$65/sqft |
Source: Long and Foster Real Estate #PG7001284 Report a problem | ||
| 3/9/2009 | Listed for sale | $239,900$65/sqft |
Source: foreclosure.com Report a problem | ||
| Year | Property taxes | Tax assessment |
|---|---|---|
| 2026 | $1,239 | $1,097,967 +9.7% |
| 2025 | $1,239 -87.7% | $1,000,633 +10.8% |
| 2024 | $10,045 +13.1% | $903,300 +13.1% |
| 2023 | $8,879 -11.6% | $798,500 -11.6% |
| 2022 | $10,045 +53.4% | $903,300 +53.4% |
| 2021 | $6,549 +2.5% | $588,900 +2.5% |
| 2020 | $6,386 -21.1% | $574,267 +5.4% |
| 2019 | $8,099 | $545,000 |
| 2018 | $8,099 +9.3% | $545,000 +9.3% |
| 2017 | $7,411 -14.8% | $498,700 +10.2% |
| 2016 | $8,698 | $452,400 +11.4% |
| 2015 | $8,698 | $406,100 |
| 2014 | $8,698 | $406,100 |
| 2013 | -- | $406,100 -22.5% |
| 2012 | -- | $524,100 |
| 2011 | -- | $524,100 +755% |
| 2010 | -- | $61,300 0% |
| 2009 | -- | $61,320 +15.7% |
| 2008 | -- | $52,986 +18.7% |
| 2007 | -- | $44,653 +22.4% |
| 2006 | -- | $36,480 |
| 2005 | -- | $36,480 |
| 2004 | -- | $36,480 |
| 2003 | -- | $36,480 |
| 2002 | -- | $36,480 |
| 2001 | -- | $36,480 |
Source: Bright MLS. This data may not be complete. We recommend contacting the local school district to confirm school assignments for this home.
A local agent can set up tours, give advice and negotiate with sellers.