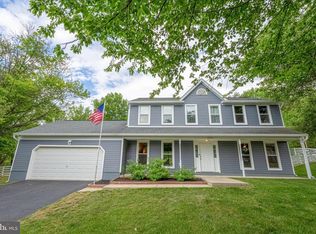
Welcome to this impressive brick-front colonial situated on a spacious lot in Brandywine, offering over three levels of comfortable living space designed for both everyday living and entertaining. Step inside to find a grand two-story foyer, hardwood flooring, and generously sized formal living and dining areas filled with natural light. The open-concept kitchen features abundant cabinetry, ample counter space, a center island, and a seamless flow into the adjacent gathering areas, making it ideal for hosting family and friends. The main level also includes a dedicated home office, providing flexibility for remote work, study space, or additional living needs. Upstairs, the expansive primary suite serves as a private retreat with a sitting area, oversized walk-in closets, and a spacious en-suite bathroom complete with dual vanities, a soaking tub, and a separate shower. Additional bedrooms offer generous room sizes and versatile use options. The lower level provides additional finished living space with endless possibilities for a recreation room, media room, fitness area, or guest accommodations. Outside, enjoy the privacy and tranquility of a large homesite while still being conveniently located near shopping, dining, parks, and commuter routes. Easy access to Route 5, Route 301, Joint Base Andrews, National Harbor, and Washington, DC makes commuting a breeze. A wonderful opportunity to enjoy space, functionality, and convenience in a desirable Brandywine location.
For sale
Price cut: $19K (7/21)
$779,999
11041 N Keys Rd, Brandywine, MD 20613
5beds
3,460sqft
:
Get pre-qualified$5,224/mo
Single Family Residence
Built in 2005
8.74 Acres Lot
$-- Zestimate®
$225/sqft
$-- HOA
What's special
- 2 days |
- 238 |
- 19 |
Zillow last checked:
Listing updated:
Listed by:
Ray Edwards 240-832-4066,
Own Real Estate (240) 615-8395,
Co-Listing Agent: Ciera Danielle Jo Bowman Murphy 240-383-2070,
Own Real Estate
Source: Bright MLS,MLS#: MDPG2212092
Facts & features
Interior
Bedrooms & bathrooms
- Bedrooms: 5
- Bathrooms: 4
- Full bathrooms: 3
- 1/2 bathrooms: 1
- Main level bathrooms: 2
- Main level bedrooms: 1
Basement
- Area: 0
Heating
- Other
Cooling
- Ceiling Fan(s), Central Air, Electric
Appliances
- Included: Microwave, Down Draft, Dishwasher, Disposal, Dryer, Exhaust Fan, Ice Maker, Oven, Refrigerator, Washer, Water Heater, Gas Water Heater
- Laundry: Main Level
Features
- Ceiling Fan(s), Crown Molding, Entry Level Bedroom, Family Room Off Kitchen, Floor Plan - Traditional, Formal/Separate Dining Room, Eat-in Kitchen, Kitchen - Gourmet, Kitchen Island, 9'+ Ceilings, Dry Wall
- Flooring: Carpet, Ceramic Tile, Concrete, Hardwood
- Basement: Connecting Stairway,Interior Entry,Exterior Entry,Rear Entrance,Space For Rooms,Sump Pump,Unfinished
- Number of fireplaces: 2
- Fireplace features: Screen
Interior area
- Total structure area: 3,460
- Total interior livable area: 3,460 sqft
- Finished area above ground: 3,460
- Finished area below ground: 0
Property
Parking
- Total spaces: 2
- Parking features: Garage Faces Side, Inside Entrance, Asphalt, Attached, Driveway
- Attached garage spaces: 2
- Has uncovered spaces: Yes
Accessibility
- Accessibility features: None
Features
- Levels: Two
- Stories: 2
- Pool features: None
Lot
- Size: 8.74 Acres
- Features: Backs to Trees, Front Yard, Wooded
Details
- Additional structures: Above Grade, Below Grade
- Parcel number: 17111183037
- Zoning: AG
- Special conditions: Standard
Construction
Type & style
- Home type: SingleFamily
- Architectural style: Colonial
- Property subtype: Single Family Residence
Materials
- Frame
- Foundation: Other
Condition
- New construction: No
- Year built: 2005
Utilities & green energy
- Sewer: Septic Exists
- Water: Well, Private
- Utilities for property: Cable Available, Electricity Available, Propane, Sewer Available, Water Available
Community & HOA
Community
- Subdivision: Brandywine
HOA
- Has HOA: No
Location
- Region: Brandywine
- Municipality: None
Financial & listing details
- Price per square foot: $225/sqft
- Tax assessed value: $887,600
- Annual tax amount: $12,600
- Date on market: 7/21/2026
- Listing agreement: Exclusive Right To Sell
- Listing terms: Cash,Conventional,FHA,USDA Loan,VA Loan
- Exclusions: Dining Room Curtains
- Ownership: Fee Simple
Estimated market value
Not available
Estimated sales range
Not available
Not available
Price history
| Date | Event | Price |
|---|---|---|
| 7/21/2026 | Price change | $779,999-2.4%$225/sqft |
Source: | ||
| 6/19/2026 | Listed for sale | $799,000+29.9%$231/sqft |
Source: | ||
| 9/1/2019 | Listing removed | $614,900$178/sqft |
Source: Better Homes and Gardens Real Estate Live Well Group #MDPG166838 Report a problem | ||
| 5/28/2019 | Price change | $614,900-2.4%$178/sqft |
Source: Better Homes and Gardens Real Estate Live Well Group #MDPG166838 Report a problem | ||
| 2/25/2019 | Price change | $629,900-1.6%$182/sqft |
Source: Better Homes and Gardens Real Estate Live Well Group #MDPG166838 Report a problem | ||
| 12/13/2018 | Listed for sale | $639,900+12.3%$185/sqft |
Source: Better Homes and Gardens Real Estate Live Well Group #MDPG166838 Report a problem | ||
| 10/18/2015 | Listing removed | $2,400$1/sqft |
Source: Zillow Rental Network Report a problem | ||
| 10/17/2015 | Listing removed | $570,000$165/sqft |
Source: RE/MAX SPECIALISTS #PG8692443 Report a problem | ||
| 10/9/2015 | Listed for rent | $2,400$1/sqft |
Source: RE/MAX SPECIALISTS #PG8768484 Report a problem | ||
| 9/5/2015 | Price change | $570,000-4.8%$165/sqft |
Source: RE/MAX SPECIALISTS #PG8692443 Report a problem | ||
| 7/14/2015 | Price change | $599,000-3.4%$173/sqft |
Source: RE/MAX SPECIALISTS #PG8692443 Report a problem | ||
| 6/20/2015 | Price change | $620,000-10.1%$179/sqft |
Source: RE/MAX SPECIALISTS #PG8671257 Report a problem | ||
| 1/14/2015 | Listed for sale | $689,900+697.6%$199/sqft |
Source: Fairfax Realty, Inc. #PG8526971 Report a problem | ||
| 12/30/2004 | Sold | $86,500$25/sqft |
Source: Agent Provided Report a problem | ||
Public tax history
| Year | Property taxes | Tax assessment |
|---|---|---|
| 2025 | $12,840 +41.7% | $872,600 +7.1% |
| 2024 | $9,060 +7.6% | $814,733 +7.6% |
| 2023 | $8,416 +8.3% | $756,867 +8.3% |
| 2022 | $7,773 +5.9% | $699,000 +5.9% |
| 2021 | $7,341 +6.3% | $660,167 +6.3% |
| 2020 | $6,909 -17.9% | $621,333 +6.7% |
| 2019 | $8,411 | $582,500 |
| 2018 | $8,411 -2.8% | $582,500 |
| 2017 | $8,656 +30% | $582,500 -1.6% |
| 2016 | $6,659 | $592,100 +7.3% |
| 2015 | $6,659 | $551,667 +7.9% |
| 2014 | $6,659 | $511,233 +8.6% |
| 2013 | -- | $470,800 |
| 2012 | -- | $470,800 |
| 2011 | -- | $470,800 -43.4% |
| 2010 | -- | $832,140 +19.8% |
| 2009 | -- | $694,462 +24.7% |
| 2008 | -- | $556,786 +32.8% |
| 2007 | -- | $419,110 +8.8% |
| 2006 | -- | $385,142 +404.7% |
| 2005 | -- | $76,316 +3.7% |
| 2004 | -- | $73,590 |
| 2003 | -- | $73,590 |
| 2002 | -- | $73,590 |
| 2001 | -- | $73,590 |
Find assessor info on the county website
Monthly payment
Est. payment
Payment breakdown
Explore the cost of this home by adjusting the details. Changes won't be saved.Climate risks
Neighborhood: 20613
Nearby schools
GreatSchools rating
- 3/10Brandywine Elementary SchoolGrades: K-5Distance: 2.1 mi
- 3/10Gwynn Park Middle SchoolGrades: 6-8Distance: 3.1 mi
- 3/10Gwynn Park High SchoolGrades: 9-12Distance: 3.1 mi
Schools provided by the listing agent
- District: Prince George's County Public Schools
Source: Bright MLS. This data may not be complete. We recommend contacting the local school district to confirm school assignments for this home.
- $410,400-- bd1 ba1k sqft11021 N Keys Rd, Brandywine, MD 20613Off Market
- $1,178,3004 bd4 ba5.4k sqft11011 N Keys Rd, Brandywine, MD 20613Off Market
- $448,911-- bd3 ba4.4k sqft11205 N Keys Rd, Brandywine, MD 20613Sold
- $879,200-- bd4 ba3.6k sqft11001 N Keys Rd, Brandywine, MD 20613Off Market
- $425,100-- bd2 ba3.1k sqft11211 N Keys Rd, Brandywine, MD 20613Off Market
- $359,500-- bd1 ba1.4k sqft11301 N Keys Rd, Brandywine, MD 20613Off Market
- $1,000,0005 bd6 ba6.4k sqft10901 N Keys Rd, Brandywine, MD 20613Sold
- $1,498,900-- bd7 ba6.7k sqft10809 N Keys Rd, Brandywine, MD 20613Off Market
A local agent can set up tours, give advice and negotiate with sellers.
Similar homes
- $745,0004 bd3 ba3.2k sqft9601 Prince William Dr, Brandywine, MD 20613For Sale

 MLS ID #MDPG2208752, Michael Kupfer, Cummings & Co. Realtors. Bright MLS
 - $782,9005 bd4 ba4.7k sqft13006 Davenport Dr, Brandywine, MD 20613For Sale
 MLS ID #MDPG2209528, Russell Chandler, Redfin Corp. Bright MLS
 - $550,0004 bd3 ba2.4k sqft12006 Lusbys Ln, Brandywine, MD 20613For Sale
 MLS ID #MDPG2211720, Les Wall, LPT Realty, LLC. Bright MLS
 - $550,0004 bd4 ba3.7k sqft15500 Letcher Rd E, Brandywine, MD 20613For Sale
 MLS ID #MDPG2207564, Ernestine Wilson, Ernestine J. Wilson Real Estate LLC. Bright MLS
 - $650,0004 bd5 ba4.3k sqft5130 Celestial Ln, Brandywine, MD 20613For SaleMLS ID #MDCH2053318, JACLYN HOYER, Northrop Realty. Bright MLS
- $750,0005 bd4 ba4.7k sqft14409 Frontier Trails Ct, Waldorf, MD 20601For SaleMLS ID #MDCH2053214, Christy Gartland, CENTURY 21 New Millennium. Bright MLS
- $664,9005 bd4 ba3.5k sqft4900 Webfoot Ct, Waldorf, MD 20601For SaleMLS ID #MDCH2057098, Lisa Wills, RE/MAX One. Bright MLS
- $699,0005 bd4 ba2.9k sqft12419 Dorsey Ln, Upper Marlboro, MD 20772For SaleMLS ID #MDPG2210128, Hanifa Kamara, Shamms Properties, LLC. Bright MLS
- $599,9993 bd3 ba3.5k sqft9411 Piaffe Cir, Upper Marlboro, MD 20772For SaleMLS ID #MDPG2212246, Hazel Shakur, Redfin Corp. Bright MLS
- $699,9004 bd3 ba2.8k sqft8200 Sycamore Cir, Owings, MD 20736For SaleMLS ID #MDCA2027324, Tiffany Oliver, RE/MAX One. Bright MLS
- $795,0006 bd4 ba4.9k sqft3025 Ali Ct, Huntingtown, MD 20639For SaleMLS ID #MDCA2028048, Jim Schaecher, Keller Williams Flagship. Bright MLS
- $679,9904 bd3 ba3.5k sqft10507 Guy Ct, Cheltenham, MD 20623For SaleMLS ID #MDPG2199060, Ron Hair, RE/MAX Leading Edge. Bright MLS
- $569,9994 bd4 ba3.3k sqft2900 Cormorant Ct, Waldorf, MD 20601For SaleMLS ID #MDCH2057304, Sharon Capitani, CENTURY 21 New Millennium. Bright MLS
- $519,9004 bd3 ba2.8k sqft15628 Chadsey Ln, Brandywine, MD 20613For SaleMLS ID #MDPG2201794, Herman Bonaparte, Coldwell Banker Realty. Bright MLS
- $569,9004 bd3 ba2.4k sqft17123 Sweetwater Ct, Hughesville, MD 20637For SaleMLS ID #MDCH2057482, Cheryl Bare, CENTURY 21 New Millennium. Bright MLS
- $799,9005 bd5 ba4.8k sqft14909 Taryn Lea Ct, Accokeek, MD 20607For SaleMLS ID #MDPG2197430, Marc Dosik, Real Broker, LLC. Bright MLS
- $620,0004 bd3 ba2.3k sqft12014 Bion Dr, Fort Washington, MD 20744For SaleMLS ID #MDPG2206196, Steve Hines, Keller Williams Capital Properties. Bright MLS
- $699,0004 bd3 ba4.4k sqft9407 Trumpet Ln, Upper Marlboro, MD 20772For SaleMLS ID #MDPG2197146, Kenita Tang, EXP Realty, LLC. Bright MLS
- $640,0005 bd4 ba5k sqft17916 Merino Dr, Accokeek, MD 20607For SaleMLS ID #MDPG2209174, Evonne Nutall, Covenant Realty Group. Bright MLS
- $620,0004 bd4 ba2.6k sqft8705 Delphi Dr, Clinton, MD 20735For SaleMLS ID #MDPG2205618, Wemmy Collins, Redfin Corp. Bright MLS
