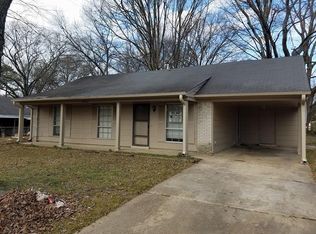
Don't miss this opportunity to add a property to your rental portfolio. Great rental area and this property is located near all types of commerce and industry. No blind offers and no wholesaler or assignment of contract offers will be accepted.
For sale
$174,900
1188 Garden Rd, Memphis, TN 38134
3beds
1,220sqft
Est.:
Single Family Residence
Built in 1970
8,712 Square Feet Lot
$171,300 Zestimate®
$143/sqft
$-- HOA
What's special
- 27 days |
- 708 |
- 34 |
Zillow last checked: 7 hours ago
Listing updated: March 11, 2026 at 02:31pm
Listed by:
Dean Harris,
CrestCore Realty MphsBrokerage 901-385-3119
Source: MAAR,MLS#: 10214838
Tour with a local agent
Facts & features
Interior
Bedrooms & bathrooms
- Bedrooms: 3
- Bathrooms: 2
- Full bathrooms: 1
- 1/2 bathrooms: 1
Primary bedroom
- Dimensions: 0 x 0
Dining room
- Dimensions: 0 x 0
Living room
- Dimensions: 0 x 0
Den
- Dimensions: 0 x 0
Heating
- Other (See REMARKS)
Cooling
- Other (See REMARKS)
Features
- Other (See Remarks), Square Feet Source: AutoFill (MAARdata) or Public Records (Cnty Assessor Site)
- Has fireplace: No
Interior area
- Total interior livable area: 1,220 sqft
Property
Parking
- Total spaces: 1
- Parking features: Other (See REMARKS)
- Covered spaces: 1
Features
- Stories: 1
- Exterior features: Other (See REMARKS)
- Pool features: None
Lot
- Size: 8,712 Square Feet
- Dimensions: 80 x 110
- Features: Other (See Remarks)
Details
- Parcel number: 089014 00080
Construction
Type & style
- Home type: SingleFamily
- Architectural style: Other (See Remarks)
- Property subtype: Single Family Residence
Condition
- New construction: No
- Year built: 1970
Community & HOA
Community
- Subdivision: Ballantrae Gardens 1st Addn Rev Blk A
Location
- Region: Memphis
Financial & listing details
- Price per square foot: $143/sqft
- Tax assessed value: $158,700
- Annual tax amount: $2,091
- Price range: $174.9K - $174.9K
- Date on market: 2/17/2026
- Cumulative days on market: 16 days
Estimated market value
$171,300
$163,000 - $180,000
$1,581/mo
Price history
Price history
| Date | Event | Price |
|---|---|---|
| 3/11/2026 | Listed for sale | $174,900$143/sqft |
Source: | ||
| 2/27/2026 | Pending sale | $174,900$143/sqft |
Source: | ||
| 2/17/2026 | Listed for sale | $174,900+8%$143/sqft |
Source: | ||
| 1/20/2026 | Listed for rent | $1,600$1/sqft |
Source: Zillow Rentals Report a problem | ||
| 1/20/2026 | Listing removed | $1,600$1/sqft |
Source: Zillow Rentals Report a problem | ||
| 1/5/2026 | Listed for rent | $1,600+0.3%$1/sqft |
Source: Zillow Rentals Report a problem | ||
| 6/1/2023 | Listing removed | -- |
Source: Zillow Rentals Report a problem | ||
| 4/26/2023 | Price change | $1,595-3.3%$1/sqft |
Source: Zillow Rentals Report a problem | ||
| 3/24/2023 | Listed for rent | $1,650$1/sqft |
Source: Zillow Rentals Report a problem | ||
| 3/9/2023 | Sold | $161,898-4.7%$133/sqft |
Source: | ||
| 2/16/2023 | Contingent | $169,900$139/sqft |
Source: | ||
| 2/13/2023 | Price change | $169,900+6.3%$139/sqft |
Source: | ||
| 2/10/2023 | Pending sale | $159,900$131/sqft |
Source: | ||
| 2/10/2023 | Listing removed | -- |
Source: | ||
| 1/29/2023 | Pending sale | $159,900$131/sqft |
Source: | ||
| 1/19/2023 | Price change | $159,900-11.2%$131/sqft |
Source: | ||
| 1/12/2023 | Pending sale | $180,000$148/sqft |
Source: | ||
| 12/8/2022 | Price change | $180,000-5.3%$148/sqft |
Source: | ||
| 10/13/2022 | Listed for sale | $190,000+104.9%$156/sqft |
Source: | ||
| 4/29/2004 | Sold | $92,750+23.7%$76/sqft |
Source: Public Record Report a problem | ||
| 2/16/2000 | Sold | $75,000+1.7%$61/sqft |
Source: Public Record Report a problem | ||
| 9/21/1999 | Sold | $73,760+8.5%$60/sqft |
Source: Public Record Report a problem | ||
| 12/18/1997 | Sold | $68,000$56/sqft |
Source: Public Record Report a problem | ||
Public tax history
Public tax history
| Year | Property taxes | Tax assessment |
|---|---|---|
| 2025 | $2,091 +21.9% | $39,675 +52.3% |
| 2024 | $1,716 +8.1% | $26,050 |
| 2023 | $1,587 | $26,050 |
| 2022 | -- | $26,050 |
| 2021 | -- | $26,050 +48.6% |
| 2020 | $560 | $17,525 |
| 2019 | $560 -21.1% | $17,525 |
| 2018 | $710 -45.1% | $17,525 |
| 2017 | $1,294 +128.2% | $17,525 +5.1% |
| 2016 | $567 -15% | $16,675 |
| 2014 | $667 | $16,675 |
| 2013 | -- | $16,675 -20.3% |
| 2012 | -- | $20,925 |
| 2011 | -- | $20,925 |
| 2010 | -- | $20,925 |
| 2009 | -- | $20,925 +0.7% |
| 2008 | -- | $20,775 |
| 2007 | -- | $20,775 |
| 2006 | -- | $20,775 |
| 2005 | -- | $20,775 +10.9% |
| 2004 | -- | $18,725 |
| 2003 | -- | $18,725 |
| 2002 | -- | $18,725 |
| 2001 | -- | $18,725 +8.6% |
| 2000 | -- | $17,250 |
Find assessor info on the county website
BuyAbility℠ payment
Est. payment
$978/mo
Principal & interest
$838
Property taxes
$140
More affordability tools
Climate risks
Neighborhood: River Oaks-Kirby-Balmoral
Nearby schools
GreatSchools rating
- 5/10White Station Elementary SchoolGrades: PK-5Distance: 2.8 mi
- 7/10White Station Middle SchoolGrades: 6-8Distance: 1.9 mi
- 8/10White Station High SchoolGrades: 9-12Distance: 3.9 mi
Local experts in 38134

Nearby cities
Nearby neighborhoods
- Cordova-Appling Real estate
- Downtown Real estate
- East Memphis-Colonial-Yorkshire Real estate
- Hickory Ridge-South Riverdale Real estate
- Midtown Real estate
- Parkway Village-Oakhaven Real estate
- Raleigh Real estate
- River Oaks-Kirby-Balmoral Real estate
- Shelby Forest-Frayser Real estate
- White Haven-Coro Lake Real estate
Nearby zip codes
Other Memphis Topics
