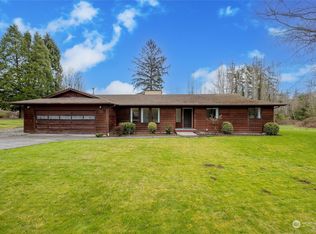
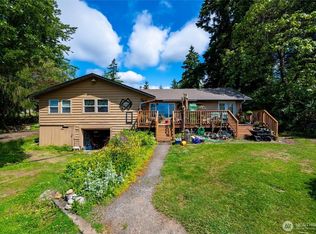
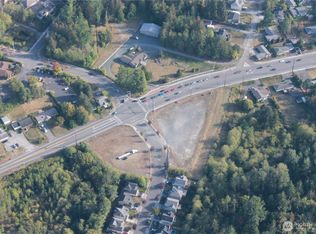
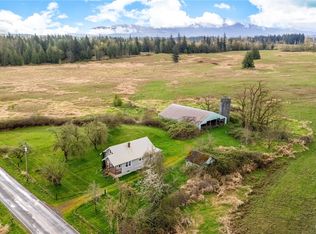
Exceptional development opportunity in Bellingham’s highly sought-after King Mountain neighborhood. Current zoning allows for high-density single-family development with potential for up to 45 lots. Under Bellingham’s Middle Housing Ordinance, up to 4 units per single-family lot is permitted, creating significant additional multifamily potential and flexibility for developers. Buyer to verify all development potential, density calculations, and permitted uses with the City of Bellingham. Property includes an existing home and outbuildings. Seller financing available with favorable terms and a low interest rate. Please do not disturb tenants.
Active
Listed by: eXp Realty
$1,950,000
1280 E Bakerview Road, Bellingham, WA 98226
--beds
--baths
7.57Acres
Unimproved Land
Built in ----
7.57 Acres Lot
$1,927,200 Zestimate®
$--/sqft
$-- HOA
What's special
- 1 day |
- 74 |
- 1 |
Zillow last checked:
Listing updated:
Listed by:
Hanna McLendon,
eXp Realty
Source: NWMLS as distributed by MLS GRID,MLS#: 2523754
Facts & features
Interior
Features
- Has fireplace: No
Interior area
- Total structure area: 0
Property
Lot
- Size: 7.57 Acres
- Features: Paved
- Topography: Level,Sloped
Details
- Parcel number: 3803074960380000
- Zoning description: Multi-Family,Residential,Jurisdiction: City
- Special conditions: Standard
Utilities & green energy
- Electric: On Property
- Gas: In Street
- Sewer: In Street, On Property
- Water: On Property, Jurisdiction: COB
- Utilities for property: Electricity Connected, Natural Gas Available
Community & HOA
Community
- Subdivision: Bakerview
Location
- Region: Bellingham
Financial & listing details
- Tax assessed value: $1,373,418
- Annual tax amount: $11,045
- Date on market: 5/15/2026
- Cumulative days on market: 2 days
- Listing terms: Conventional,FHA
- Electric utility on property: Yes
- Road surface type: Paved
Estimated market value
$1,927,200
$1.83M - $2.02M
$2,584/mo
Price history
| Date | Event | Price |
|---|---|---|
| 5/16/2026 | Listed for sale | $1,950,000+34.5% |
Source: | ||
| 3/9/2025 | Listing removed | $1,600 |
Source: Zillow Rentals Report a problem | ||
| 2/20/2025 | Listed for rent | $1,600+10.3% |
Source: Zillow Rentals Report a problem | ||
| 9/6/2022 | Sold | $1,450,000-9.4% |
Source: | ||
| 5/13/2022 | Pending sale | $1,600,000 |
Source: | ||
| 4/15/2022 | Listed for sale | $1,600,000+120.7% |
Source: | ||
| 2/7/2019 | Listing removed | $1,450 |
Source: SOUND REALTY Report a problem | ||
| 1/7/2019 | Listed for rent | $1,450+31.8% |
Source: SOUND REALTY Report a problem | ||
| 12/2/2017 | Listing removed | $1,100 |
Source: Wm. T. Follis, LLC, Realtors Report a problem | ||
| 11/30/2017 | Listed for rent | $1,100 |
Source: Zillow Rental Manager Report a problem | ||
| 9/15/2017 | Sold | $725,000 |
Source: | ||
Public tax history
| Year | Property taxes | Tax assessment |
|---|---|---|
| 2024 | $11,280 +7.6% | $1,373,418 +2.3% |
| 2023 | $10,486 +18.6% | $1,342,539 +29% |
| 2022 | $8,842 +10.4% | $1,040,728 +21% |
| 2021 | $8,008 +98.9% | $860,106 +5.4% |
| 2020 | $4,027 -50% | $816,375 +5% |
| 2019 | $8,054 +0.5% | $777,500 +7.7% |
| 2018 | $8,017 +7.6% | $722,201 +8.3% |
| 2017 | $7,448 -7.4% | $666,902 +16.4% |
| 2016 | $8,039 +29.7% | $572,894 +2.8% |
| 2015 | $6,198 | $557,187 +73.2% |
| 2014 | $6,198 +67.2% | $321,779 -0.6% |
| 2013 | $3,706 | $323,572 +6.3% |
| 2012 | -- | $304,309 |
| 2011 | -- | $304,309 -1.1% |
| 2010 | -- | $307,833 -4.1% |
| 2009 | $2,544 -6.2% | $321,060 +21.8% |
| 2008 | $2,712 | $263,545 |
| 2007 | $2,712 +23.2% | $263,545 |
| 2005 | $2,200 | $263,545 +56.7% |
| 2004 | $2,200 -3.5% | $168,135 |
| 2003 | $2,281 +1.9% | $168,135 |
| 2002 | $2,238 +0.1% | $168,135 |
| 2001 | $2,235 | $168,135 +24% |
| 2000 | -- | $135,575 |
| 1999 | -- | $135,575 |
Find assessor info on the county website
Monthly payment
Estimated monthly payment
All calculations are estimates and provided by Zillow, Inc. for informational purposes only. Actual amounts may vary.
HOA fees may include property taxes on listings classified as Co-Ops. Contact the listing agent and/or owner for fee details.
Mortgage interest rates are dependent on a number of factors, including credit score, down payment, and repayment length. Interest rate data provided by Zillow Group Marketplace, Inc. as of 1/1/1970 from various mortgage lenders with which we have lead or other similar arrangements; the Estimated Payment is an average of those rates.
See how much you could borrow to make a competitive offer.
Climate risks
Neighborhood: King Mountain
Nearby schools
GreatSchools rating
- 4/10Cordata Elementary SchoolGrades: PK-5Distance: 1.9 mi
- 6/10Whatcom Middle SchoolGrades: 6-8Distance: 2.2 mi
- 7/10Squalicum High SchoolGrades: 9-12Distance: 2.1 mi
A local agent can set up tours, give advice and negotiate with sellers.
A local lender can help you make sure your offer is ready when you are.


- Washington
- Whatcom County
- Bellingham
- 98226
- King Mountain
- 1280 E Bakerview Road
Nearby cities
Nearby neighborhoods
Nearby zip codes
Other Bellingham Topics
