This is a 5 bedroom, 2.0 bathroom, single family home. This home is located at 1300 N Pecan Rd, Ponca City, OK 74604.
For sale
$315,000
1300 N Pecan Rd, Ponca City, OK 74604
5beds
2baths
--sqft
Single Family Residence
Built in ----
1 Acres Lot
$304,200 Zestimate®
$--/sqft
$-- HOA
What's special
- 6 hours
- 48
- 0
Zillow last checked:
Listed by:
Natascha Holloway,
Rockin Double J, LLC
Source: United Country,MLS#: 35120-500000
Facts & features
Interior
Bedrooms & bathrooms
- Bedrooms: 5
- Bathrooms: 2
Features
- Has basement: No
- Has fireplace: No
Property
Lot
- Size: 1 Acres
Details
- Parcel number: 360002001
Construction
Type & style
- Home type: SingleFamily
- Property subtype: Single Family Residence
Community & HOA
Location
- Region: Ponca City
Financial & listing details
- Tax assessed value: $237,740
- Annual tax amount: $2,501
- Date on market: 11/5/2026
- Lease term: Contact For Details
Estimated market value
$304,200
$289,000 - $319,000
$2,363/mo
Price history
| Date | Event | Price |
|---|---|---|
| 11/5/2026 | Listed for sale | $315,000-1.5% |
Source: United Country #35120-500000 Report a problem | ||
| 9/30/2026 | Listing removed | $319,900 |
Source: North Central BOR (OK) #41345 Report a problem | ||
| 7/19/2026 | Listed for sale | $319,900+75% |
Source: North Central BOR (OK) #41345 Report a problem | ||
| 11/12/2024 | Sold | $182,758-54.2% |
Source: Public Record Report a problem | ||
| 3/1/2023 | Listing removed | -- |
Source: North Central BOR (OK) Report a problem | ||
| 8/1/2022 | Price change | $399,000-6.1% |
Source: North Central BOR (OK) #38248 Report a problem | ||
| 7/17/2022 | Listed for sale | $425,000+63.5% |
Source: North Central BOR (OK) #38248 Report a problem | ||
| 7/14/2017 | Sold | $260,000+48.6% |
Source: Public Record Report a problem | ||
| 2/20/2013 | Sold | $175,000 |
Source: Public Record Report a problem | ||
Public tax history
| Year | Property taxes | Tax assessment |
|---|---|---|
| 2025 | $2,501 +31.4% | $26,151 +30.1% |
| 2024 | $1,903 -1.8% | $20,100 |
| 2023 | $1,938 +11.7% | $20,100 +10.3% |
| 2022 | $1,735 -0.5% | $18,231 |
| 2021 | $1,744 +1% | $18,231 |
| 2020 | $1,726 +2.2% | $18,231 +3.2% |
| 2019 | $1,688 -6.9% | $17,667 -4.5% |
| 2017 | $1,813 -2.7% | $18,497 -1.7% |
| 2016 | $1,863 +0.1% | $18,817 +0.5% |
| 2015 | $1,862 +1.2% | $18,720 -0.6% |
| 2014 | $1,839 +3.7% | $18,842 +0.3% |
| 2013 | $1,774 -5.2% | $18,794 -0.1% |
| 2012 | $1,871 +4% | $18,815 -3.3% |
| 2011 | $1,799 -0.7% | $19,466 -1.9% |
| 2010 | $1,812 -2.3% | $19,841 -2.2% |
| 2009 | $1,854 +0.5% | $20,280 |
| 2008 | $1,844 -5.7% | $20,280 -4.8% |
| 2007 | $1,955 | $21,293 |
Find assessor info on the county website
Monthly payment
Est. payment
Payment breakdown
Explore the cost of this home by adjusting the details. Changes won't be saved.Climate risks
Neighborhood: 74604
Similar homes
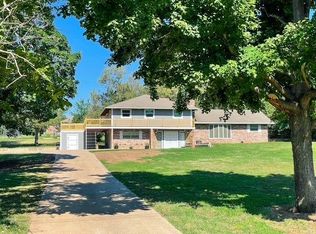
- $289,9004 bd2 ba1.9k sqft2514 Bluestem Rd, Ponca City, OK 74604For Sale
 MLS ID #41527, Liz Greene. North Central BOR (OK)
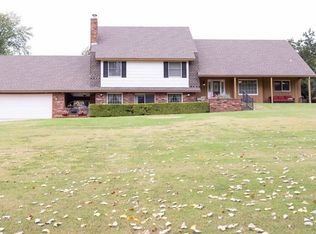
- $289,0004 bd3 ba2.6k sqft1500 Dover Dr, Ponca City, OK 74604For Sale
 MLS ID #41228, Christine Fletcher. North Central BOR (OK)
- $329,0003 bd3 ba1.9k sqft804 Monument Rd, Ponca City, OK 74604For Sale
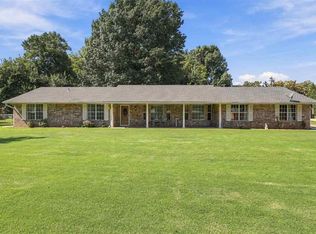 MLS ID #41474, Caleb Crenshaw. North Central BOR (OK)
- $225,0003 bd2 ba2k sqft3617 Mistletoe Dr, Ponca City, OK 74604For Sale
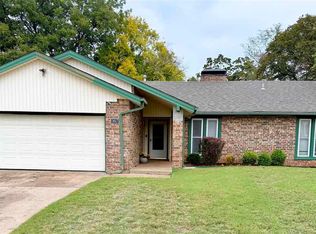 MLS ID #41544, Donna Reid. North Central BOR (OK)
