$437,000
2 bd|2 ba|972 sqft
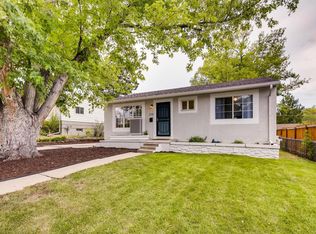
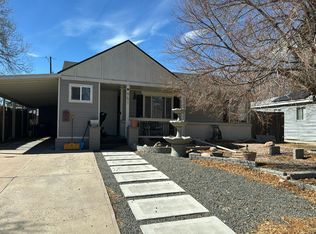
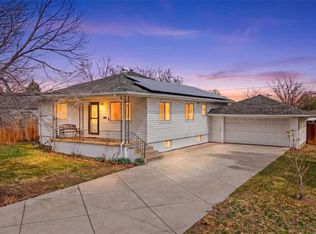
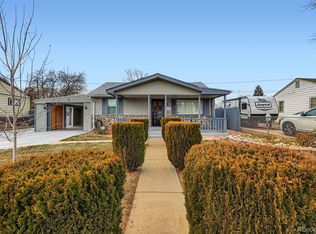
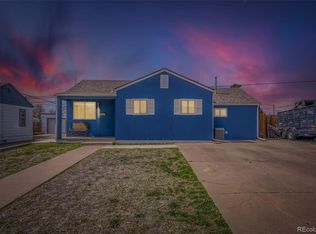
1769 S Clay St, Denver, CO 80219
Off Market
Zillow last checked: 7 hours ago
Listing updated: March 25, 2024 at 03:07pm
Sold Comp 303-850-9576,
Sold Entered for Comps Only
Visit our professional directory to find a foreclosure specialist in your area that can help with your home search.
Find a foreclosure agent$450,800
$428,000 - $473,000
$2,589/mo
| Date | Event | Price |
|---|---|---|
| 12/15/2023 | Sold | $450,000$231/sqft |
Source: | ||
| Year | Property taxes | Tax assessment |
|---|---|---|
| 2024 | $2,101 +22.3% | $27,110 -9.9% |
| 2023 | $1,717 +3.6% | $30,080 +39.3% |
| 2022 | $1,657 -2.2% | $21,590 -2.8% |
| 2021 | $1,695 +2.9% | $22,210 -2.8% |
| 2020 | $1,648 +24.7% | $22,852 -0.7% |
| 2019 | $1,321 | $23,011 +34.7% |
| 2018 | $1,321 +0.3% | $17,080 |
| 2017 | $1,317 +59.5% | $17,080 +61.6% |
| 2016 | $826 +5.7% | $10,570 |
| 2015 | $782 0% | $10,570 +12.3% |
| 2014 | $782 +1.4% | $9,410 |
| 2013 | $771 +17.9% | $9,410 +2.6% |
| 2012 | $654 -4.6% | $9,170 |
| 2011 | $685 +2.2% | $9,170 -10.9% |
| 2010 | $670 -28.8% | $10,290 |
| 2009 | $941 -0.2% | $10,290 -27% |
| 2008 | $943 -8.2% | $14,090 |
| 2007 | $1,027 +1.1% | $14,090 -8.1% |
| 2006 | $1,016 +10.6% | $15,340 |
| 2005 | $918 +16.9% | $15,340 +4.7% |
| 2003 | $786 +1.9% | $14,650 +11.6% |
| 2002 | $771 | $13,130 +22.8% |
| 2001 | -- | $10,690 |
Find assessor info on the county website