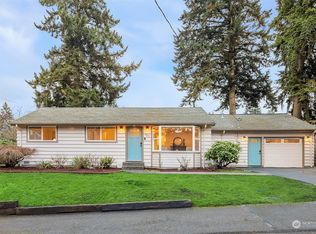
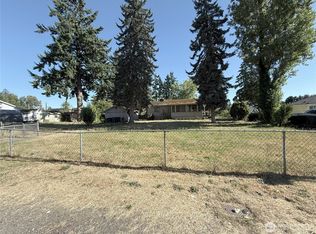
This exceptional property features 3 detached single-family homes on a 1/2-acre lot, currently earning $50,400 annually with potential to reach $73,560. Investors can boost rental income to market rates or leverage permits for redevelopment into 35 apartments and 5,000 square feet of commercial space. Explore options like townhouse condos or commercial-only setups. Situated in a thriving urban village near Renton Highlands, with nearby projects adding 700 multifamily units, 100 townhouses, and 40,000 square feet of retail space. Ideal for visionary investors seeking growth and opportunity, just minutes from shopping and dining!
Active
Listed by: Berkshire Hathaway HS NW • Martin J. Ho • 425-499-8909
$1,250,000
1409 Monroe Avenue NE, Renton, WA 98056
6beds
3baths
2,090sqft
Triplex, Multi Family
Built in 1942
-- sqft lot
$1,184,600 Zestimate®
$598/sqft
$-- HOA
What's special
- --
- on Zillow
- 122
- views
- 0
- saves
Likely to sell faster than
Zillow last checked:
Listing updated:
Listed by:
Martin J. Ho 425-499-8909 team@ho-realty.com,
Berkshire Hathaway HS NW
Source: NWMLS as distributed by MLS GRID,MLS#: 2592596
Facts & features
Interior
Bedrooms & bathrooms
- Bedrooms: 6
- Bathrooms: 3
Heating
- Baseboard, Electric
Cooling
- Heat Pump
Features
- Has fireplace: No
Interior area
- Total structure area: 2,090
- Total interior livable area: 2,090 sqft
Property
Parking
- Total spaces: 13
- Parking features: Garage
- Garage spaces: 1
- Carport spaces: 2
- Covered spaces: 3
- Uncovered spaces: 10
Lot
- Size: 0.5 Acres
- Features: Corner Lot, Curbs, Sidewalk
Details
- Parcel number: 0423059104
- Special conditions: Standard
Construction
Type & style
- Home type: MultiFamily
- Architectural style: Tri-plex
- Property subtype: Triplex, Multi Family
Materials
- Wood Siding
- Roof: Composition
Condition
- Year built: 1942
- Major remodel year: 1942
Utilities & green energy
- Electric: Company: PSE
- Sewer: Sewer Connected, Company: City of Renton
- Water: Public, Company: City of Renton
Community & HOA
Community
- Subdivision: Renton
Location
- Region: Renton
Financial & listing details
- Price per square foot: $598/sqft
- Tax assessed value: $790,000
- Annual tax amount: $7,848
- Date on market: 10/18/2026
- Listing terms: Conventional
Estimated market value
$1,184,600
$1.13M - $1.24M
$2,753/mo
Price history
| Date | Event | Price |
|---|---|---|
| 10/18/2026 | Listed for sale | $1,250,000-3.8%$598/sqft |
Source:  NWMLS as distributed by MLS GRID #2592596 Report a problem | ||
| 8/2/2026 | Listing removed | $1,300,000$622/sqft |
Source:  Berkshire Hathaway HomeServices NW #NWM2430021 Report a problem | ||
| 5/12/2026 | Listed for sale | $1,300,000-5.8%$622/sqft |
Source: Berkshire Hathaway HomeServices NW #NWM2430021 Report a problem | ||
| 9/11/2025 | Listed for sale | $1,380,000+6.2%$660/sqft |
Source: Berkshire Hathaway HomeServices NW #NWM2430021 Report a problem | ||
| 6/16/2023 | Sold | $1,300,000-3.7%$622/sqft |
Source: NWMLS as distributed by MLS GRID #2022241 Report a problem | ||
| 5/10/2023 | Pending sale | $1,350,000$646/sqft |
Source: NWMLS as distributed by MLS GRID #NWM2022241 Report a problem | ||
| 4/13/2023 | Price change | $1,350,000-12.9%$646/sqft |
Source: NWMLS as distributed by MLS GRID #NWM2022241 Report a problem | ||
| 1/2/2023 | Listed for sale | $1,550,000+124.6%$742/sqft |
Source: NWMLS as distributed by MLS GRID #2022241 Report a problem | ||
| 4/15/2016 | Sold | $690,000-1.3%$330/sqft |
Source: NWMLS as distributed by MLS GRID #823692 Report a problem | ||
| 8/8/2015 | Pending sale | $699,000$334/sqft |
Source: John L Scott Real Estate #766490 Report a problem | ||
| 7/17/2015 | Price change | $699,000-5.5%$334/sqft |
Source: John L Scott Real Estate #766490 Report a problem | ||
| 6/26/2015 | Listed for sale | $740,000$354/sqft |
Source: John L Scott Real Estate #766490 Report a problem | ||
| 6/9/2015 | Pending sale | $740,000$354/sqft |
Source: John L Scott Real Estate #766490 Report a problem | ||
| 4/11/2015 | Price change | $740,000+5.7%$354/sqft |
Source: John L Scott Real Estate #766490 Report a problem | ||
| 3/16/2015 | Listed for sale | $700,000-12.5%$335/sqft |
Source: Owner Report a problem | ||
| 12/2/2014 | Listing removed | $800,000$383/sqft |
Source: John L Scott Real Estate #631203 Report a problem | ||
| 5/3/2014 | Listed for sale | $800,000+310.3%$383/sqft |
Source: John L Scott Real Estate #629768 Report a problem | ||
| 8/7/1998 | Sold | $195,000$93/sqft |
Source: Public Record Report a problem | ||
Public tax history
| Year | Property taxes | Tax assessment |
|---|---|---|
| 2025 | $8,521 +8.6% | $790,000 +3.1% |
| 2024 | $7,848 +1.3% | $766,000 +7.9% |
| 2023 | $7,748 -4.4% | $710,000 -13.5% |
| 2022 | $8,104 -15.2% | $821,000 -3.1% |
| 2021 | $9,553 +12.8% | $847,000 +18.5% |
| 2020 | $8,466 +3.4% | $715,000 +0.8% |
| 2019 | $8,186 +6.3% | $709,000 +2.6% |
| 2018 | $7,699 -5.2% | $691,000 +10% |
| 2017 | $8,118 +138.9% | $628,000 +14% |
| 2016 | $3,398 | $551,000 +36.7% |
| 2015 | $3,398 | $403,000 +50.4% |
| 2014 | $3,398 | $268,000 +28.8% |
| 2013 | $3,398 | $208,000 -8.8% |
| 2012 | -- | $228,000 -2.1% |
| 2011 | -- | $233,000 +25.3% |
| 2010 | -- | $186,000 |
| 2009 | -- | $186,000 +2.2% |
| 2007 | -- | $182,000 +9% |
| 2006 | -- | $167,000 |
| 2005 | -- | $167,000 +17.6% |
| 2000 | $1,843 | $142,000 |
Find assessor info on the county website
Monthly payment
Est. payment
Payment breakdown
Explore the cost of this home by adjusting the details. Changes won't be saved.Climate risks
Neighborhood: President Park


Similar homes
- $998,0004 bd2 ba1.9k sqft1311 N 36th Street, Renton, WA 98056Active
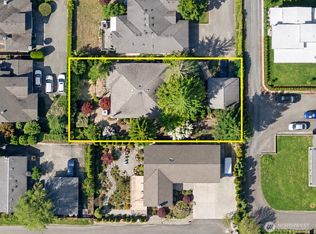 MLS ID #2584969, Ryan Newman. NWMLS as distributed by MLS GRID
- $1,299,9903 bd3 ba2.2k sqftLakeview Terrace, Renton, WA 98056Active
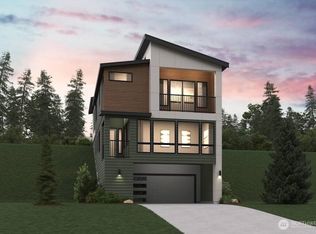 NWMLS as distributed by MLS GRID
- $849,0003 bd1 ba1.3k sqft957 Aberdeen Avenue NE, Renton, WA 98056Active
 MLS ID #2547789, Jay Janssen. NWMLS as distributed by MLS GRID
- $1,249,9504 bd3 ba1.9k sqft3152 NE 82nd Street, Seattle, WA 98115Active
 MLS ID #2597658, Megan Halter. NWMLS as distributed by MLS GRID
