A two minute walk to the Mill District in North Amherst or the Mill River Recreation Area with pickleball, tennis, and basketball courts and a pool, this sunny, well cared for home offers flexible living with separate utilities and updated kitchens. You will appreciate the two car garage and the fenced backyard, perfect for outdoor time with some privacy. Inside, all pine floors add warmth and character throughout. The first floor features two comfortable bedrooms, a lovely kitchen with pantry, and one bath. The second floor includes three bedrooms, a recently renovated kitchen, and one bath. Convenience is built in, with the UMass Campus about two miles away, plus easy walking access to Puffers Pond and nature trails.
For sale by owner
$624,900
159 Montague Rd, Amherst, MA 01002
5beds
2,230sqft
MultiFamily
Built in 1907
-- sqft lot
$-- Zestimate®
$280/sqft
$-- HOA
What's special
Two car garageUpdated kitchens
What the owner loves about this home
Solidly built and well maintained
- 14 days
- 443
- 16
Listed by:
Property Owner (413) 530-8928
Facts & features
Interior
Bedrooms & bathrooms
- Bedrooms: 5
- Bathrooms: 2
- Full bathrooms: 2
Heating
- Other, Oil
Appliances
- Included: Dishwasher, Range / Oven, Refrigerator
Features
- Flooring: Softwood
- Basement: Unfinished
Interior area
- Total interior livable area: 2,230 sqft
Property
Parking
- Parking features: Garage - Detached
Features
- Exterior features: Shingle
- View description: None
Lot
- Size: 0.33 Acres
Details
- Parcel number: AMHEM0005AB0000L0065
Construction
Type & style
- Home type: MultiFamily
Materials
- Roof: Asphalt
Condition
- New construction: No
- Year built: 1907
Community & HOA
Location
- Region: Amherst
Financial & listing details
- Price per square foot: $280/sqft
- Tax assessed value: $458,600
- Annual tax amount: $8,232
- Date on market: 10/14/2026
Estimated market value
Not available
Estimated sales range
Not available
$2,463/mo
Price history
| Date | Event | Price |
|---|---|---|
| 10/14/2026 | Listed for sale | $624,900+177.1%$280/sqft |
Source: Owner Report a problem | ||
| 3/26/2018 | Listing removed | $1,635$1/sqft |
Source: 413 Lease LLC Report a problem | ||
| 3/15/2018 | Listed for rent | $1,635+9%$1/sqft |
Source: 413 Lease LLC Report a problem | ||
| 5/3/2011 | Listing removed | $1,500$1/sqft |
Source: Eagle Crest Property Management Report a problem | ||
| 4/27/2011 | Listed for rent | $1,500$1/sqft |
Source: Eagle Crest Property Management Report a problem | ||
| 6/25/2004 | Sold | $225,500+89.5%$101/sqft |
Source: Public Record Report a problem | ||
| 9/3/1996 | Sold | $119,000$53/sqft |
Source: Public Record Report a problem | ||
Public tax history
| Year | Property taxes | Tax assessment |
|---|---|---|
| 2025 | $8,232 +5.8% | $458,600 +9.1% |
| 2024 | $7,782 +4.8% | $420,400 +13.8% |
| 2023 | $7,427 +3.8% | $369,500 +9.8% |
| 2022 | $7,157 +0.2% | $336,500 +2.7% |
| 2021 | $7,146 +2.3% | $327,500 |
| 2020 | $6,982 +3.8% | $327,500 +6.2% |
| 2019 | $6,725 +3.1% | $308,500 |
| 2018 | $6,522 +2.7% | $308,500 +6% |
| 2017 | $6,353 +2.9% | $291,000 |
| 2016 | $6,175 +3.3% | $291,000 |
| 2015 | $5,977 +2.2% | $291,000 +4.4% |
| 2014 | $5,846 +2.8% | $278,800 |
| 2013 | $5,685 +3.3% | $278,800 |
| 2012 | $5,504 +6.6% | $278,800 -1.7% |
| 2011 | $5,162 +7.4% | $283,600 |
| 2010 | $4,807 +4.7% | $283,600 -2.3% |
| 2009 | $4,593 +8.5% | $290,300 +9.8% |
| 2008 | $4,234 +12% | $264,300 +9.6% |
| 2007 | $3,782 +4.1% | $241,200 |
| 2006 | $3,632 | $241,200 +10.8% |
| 2005 | $3,632 +9.6% | $217,600 +14.2% |
| 2004 | $3,315 +3.6% | $190,500 +1.9% |
| 2003 | $3,200 -2.5% | $187,000 +8.3% |
| 2002 | $3,281 +27.1% | $172,700 +22.7% |
| 1997 | $2,582 | $140,800 |
Find assessor info on the county website
Monthly payment
Est. payment
Payment breakdown
Explore the cost of this home by adjusting the details. Changes won't be saved.Climate risks
Neighborhood: North Amherst

Similar homes
- $699,0004 bd4 ba2k sqft7 Emily Ln, Amherst, MA 01002For Sale
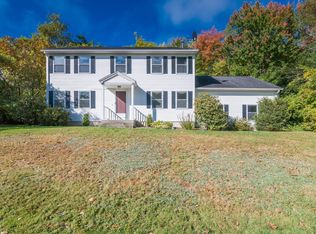 MLS ID #73588598, Raphael Elison, Brick & Mortar. MLS PIN
- $565,0005 bd2 ba1.8k sqft210 Strong St, Amherst, MA 01002For Sale
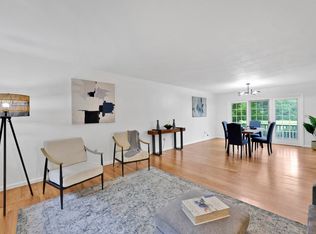 MLS ID #73568526, Karen Kopeski, Today Real Estate, Inc.. MLS PIN
- $775,0005 bd3 ba2.6k sqft18 Dana St, Amherst, MA 01002For Sale
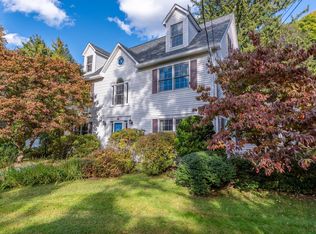 MLS ID #73589984, Greg Stutsman, Brick & Mortar. MLS PIN
- $699,0005 bd2 ba1.7k sqft155 Amity St, Amherst, MA 01002For Sale
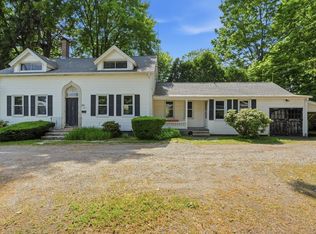 MLS ID #73537461, Heather Ferrari Homes Team, William Raveis R.E. & Home Services. MLS PIN
