..
This property is off market, which means it's not currently listed for sale or rent on Zillow. This may be different from what's available on other websites or public sources.
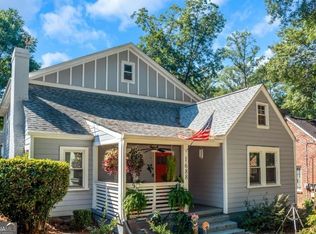
$299,100
$275,000 - $323,000
$2,260/mo
$2,260/mo
Rent Zestimate®
Find your next renter with Zillow Rental Manager. Plus, with online applications, you can quickly screen prospective tenants – for free.
$2,260/mo
Rent Zestimate®
$1,854/mo
Est. payment
Refinancing to a lower rate could help reduce your monthly payments and save thousands over the life of the loan.
$1,854/mo
Est. payment
Work with a Zillow partner agent
Leverage their expertise and Zillow's premium Showcase listings to get your home seen by more buyers.
Get startedList with your own agent
Get your home in front of millions of buyers by listing it on Zillow.
Learn how to do itSell it yourself
Take full control of how buyers see your home on Zillow by listing For Sale by Owner (FSBO).
List your home..
This property is off market, which means it's not currently listed for sale or rent on Zillow. This may be different from what's available on other websites or public sources.
| Date | Event | Price |
|---|---|---|
| 12/14/2021 | Listing removed | -- |
Source: Zillow Rental Manager Report a problem | ||
| 12/10/2021 | Listed for rent | $2,000+0.3%$1/sqft |
Source: Zillow Rental Manager Report a problem | ||
| 4/9/2021 | Listing removed | -- |
Source: Zillow Rental Network Premium Report a problem | ||
| 3/17/2021 | Price change | $1,995-9.1%$1/sqft |
Source: Zillow Rental Network Premium Report a problem | ||
| 2/21/2021 | Listed for rent | $2,195$1/sqft |
Source: Zillow Rental Network Premium Report a problem | ||
| 2/10/2021 | Listing removed | -- |
Source: Zillow Rental Network Premium Report a problem | ||
| 1/28/2021 | Listed for rent | $2,195$1/sqft |
Source: Zillow Rental Network Premium Report a problem | ||
| 1/7/2021 | Sold | $310,000-3.1%$202/sqft |
Source: | ||
| 12/24/2020 | Pending sale | $320,000$209/sqft |
Source: Keller Williams Realty Atlanta Partners #6788231 Report a problem | ||
| 12/10/2020 | Price change | $320,000-1.5%$209/sqft |
Source: Keller Williams Realty Atlanta Partners #6788231 Report a problem | ||
| 8/2/2020 | Listed for sale | $325,000+116.7%$212/sqft |
Source: Keller Williams Realty Atlanta Partners #6761037 Report a problem | ||
| 4/4/2019 | Sold | $150,000-16.7%$98/sqft |
Source: Public Record Report a problem | ||
| 3/25/2019 | Pending sale | $180,000$117/sqft |
Source: KELLER WILLIAMS BUCKHEAD #6125560 Report a problem | ||
| 2/28/2019 | Price change | $180,000-5.3%$117/sqft |
Source: Keller Williams Realty Premier Atlanta #6125560 Report a problem | ||
| 1/28/2019 | Listed for sale | $190,000-11.6%$124/sqft |
Source: Keller Williams Rlty. Buckhead #8516351 Report a problem | ||
| 9/2/2018 | Listing removed | $215,000$140/sqft |
Source: Keller Williams Realty Premier Atlanta #6028111 Report a problem | ||
| 7/4/2018 | Price change | $215,000-4.4%$140/sqft |
Source: Keller Williams Realty Premier Atlanta #6028111 Report a problem | ||
| 6/15/2018 | Listed for sale | $225,000+718.2%$147/sqft |
Source: Keller Williams Rlty. Buckhead #8399505 Report a problem | ||
| 5/4/2016 | Sold | $27,500+27.9%$18/sqft |
Source: | ||
| 4/22/2016 | Pending sale | $21,500$14/sqft |
Source: CENTURY 21 Connect Realty #5676983 Report a problem | ||
| 4/15/2016 | Listed for sale | $21,500-55.2%$14/sqft |
Source: CENTURY 21 CONNECT REALTY #07624423 Report a problem | ||
| 8/4/2015 | Sold | $48,000$31/sqft |
Source: Public Record Report a problem | ||
| Year | Property taxes | Tax assessment |
|---|---|---|
| 2024 | $5,342 +28.3% | $130,480 |
| 2023 | $4,162 -17.1% | $130,480 +5.2% |
| 2022 | $5,018 +73.7% | $124,000 +73.9% |
| 2021 | $2,889 +11.1% | $71,320 +13.6% |
| 2020 | $2,600 +51.9% | $62,800 +116.3% |
| 2019 | $1,712 | $29,040 -2.7% |
| 2018 | $1,712 | $29,840 +55.4% |
| 2017 | $1,712 +31.1% | $19,200 |
| 2016 | $1,305 +266.8% | $19,200 +45.5% |
| 2015 | $356 +2031% | $13,200 |
| 2014 | $17 | $13,200 +39.8% |
| 2013 | -- | $9,440 -11.9% |
| 2012 | -- | $10,720 -32.2% |
| 2011 | -- | $15,800 |
| 2010 | $19 -80.6% | $15,800 -45.7% |
| 2009 | $98 | $29,080 -9.2% |
| 2008 | -- | $32,040 |
| 2007 | -- | $32,040 +0.1% |
| 2005 | -- | $32,000 +3.6% |
| 2004 | -- | $30,880 +3.6% |
| 2003 | $346 +297.2% | $29,800 +3% |
| 2002 | $87 -70.1% | $28,920 +10.4% |
| 2001 | $291 | $26,200 |
Source: The MLS. This data may not be complete. We recommend contacting the local school district to confirm school assignments for this home.
