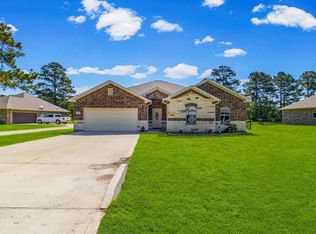
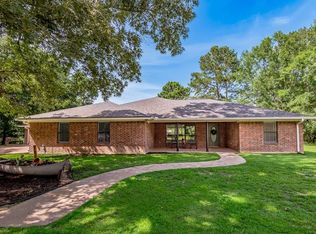
This is an in impressive beautifully updated 3 bed, 2.5 bath brick home on a corner double lot. Excellent condition with fresh paint, stunning granite counters, backsplash, new appliances, pull-out cabinets, and double vanities plus dual closets in the primary bath. Dedicated dining room for formal meals and enclosed porch/flex space. It is hard to describe in words. You really should come see this one.
The 24x35x14 RV carport with storage shed, dump station and a 30amp service. It provides excellent space for RVs, boats, and toys. Adjoining cleared lot is included for added room and privacy. GENERAC standby generator offers peace of mind. This house combines great space all nestled in nature.
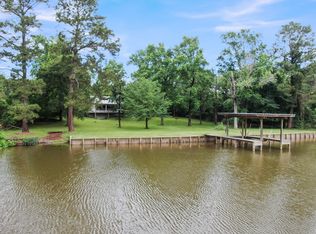
Gated, highly social community featuring an 18-hole golf course, tennis, swimming, marina, boat ramp access to Lake Livingston, bird sanctuary, and clubs including poker, bridge, dominoes, book club, men’s and women’s groups, and more. On-site café with great food adds to the lifestyle.
For sale
Price increase: $16K (5/14)
$350,000
17 Cottonwood Rd, Trinity, TX 75862
3beds
2,031sqft
Single Family Residence
Built in 1998
0.47 Acres Lot
$340,500 Zestimate®
$172/sqft
$-- HOA
What's special
Fresh paintNew appliancesStunning granite countersCorner double lotDouble vanitiesPull-out cabinets
- 55 days |
- 274 |
- 11 |
Zillow last checked:
Listing updated:
Listed by:
David Whiteman TREC #0634930 972-369-3035,
Pinnacle Realty Advisors
Source: HAR,MLS#: 55481378
Loading...
Facts & features
Interior
Bedrooms & bathrooms
- Bedrooms: 3
- Bathrooms: 3
- Full bathrooms: 2
- 1/2 bathrooms: 1
Rooms
- Room types: Utility Room
Heating
- Electric
Cooling
- Electric
Appliances
- Included: Disposal, Dryer, Refrigerator, Washer, Electric Oven, Microwave, Electric Range, Dishwasher
- Laundry: Electric Dryer Hookup, Washer Hookup
Features
- Crown Molding, Walk-In Closet(s)
- Flooring: Carpet, Tile
- Number of fireplaces: 1
- Fireplace features: Gas Log
Interior area
- Total structure area: 2,031
- Total interior livable area: 2,031 sqft
Property
Parking
- Total spaces: 2
- Parking features: Attached, Double-Wide Driveway, Golf Cart Garage, RV Access/Parking, Attached Carport
- Attached garage spaces: 2
- Has carport: Yes
Features
- Stories: 1
- Patio & porch: Covered, Patio/Deck, Porch, Screened
- Exterior features: Side Yard
Lot
- Size: 0.47 Acres
- Features: Corner Lot, Cul-De-Sac, Near Golf Course, Subdivided, 1/4 Up to 1/2 Acre
Details
- Additional structures: Shed(s)
- Parcel number: 24649
Construction
Type & style
- Home type: SingleFamily
- Architectural style: Traditional
- Property subtype: Single Family Residence
Materials
- Brick
- Foundation: Slab
- Roof: Composition
Condition
- New construction: No
- Year built: 1998
Utilities & green energy
- Sewer: Public Sewer
- Water: Water District
Community & HOA
Community
- Features: Subdivision Tennis Court
- Subdivision: Westwood Shores Sec 1
HOA
- Has HOA: Yes
- Amenities included: Beach Access, Boat Dock, Boat Ramp, Clubhouse, Controlled Access, Fitness Center, Golf Course, Marina, Park, Picnic Area, Playground, Pond, Pool, RV Parking, RV/Boat Storage, Security, Sport Court, Stocked Pond, Tennis Court(s)
Location
- Region: Trinity
Financial & listing details
- Price per square foot: $172/sqft
- Tax assessed value: $337,822
- Annual tax amount: $7,526
- Date on market: 5/7/2026
- Listing terms: Cash,Conventional,FHA,VA Loan
- Exclusions: Personal Property
- Road surface type: Asphalt
Estimated market value
$340,500
$323,000 - $358,000
$1,879/mo
Price history
| Date | Event | Price |
|---|---|---|
| 5/14/2026 | Price change | $350,000+4.8%$172/sqft |
Source: | ||
| 3/13/2025 | Price change | $334,000-1.7%$164/sqft |
Source: | ||
| 1/12/2025 | Listed for sale | $339,900-1.5%$167/sqft |
Source: | ||
| 8/31/2024 | Listing removed | $345,000$170/sqft |
Source: | ||
| 6/12/2024 | Price change | $345,000-1.4%$170/sqft |
Source: | ||
| 5/13/2024 | Listed for sale | $350,000$172/sqft |
Source: | ||
| 5/7/2024 | Listing removed | -- |
Source: | ||
| 3/5/2024 | Listed for sale | $350,000$172/sqft |
Source: | ||
| 2/29/2024 | Pending sale | $350,000$172/sqft |
Source: | ||
| 12/1/2023 | Price change | $350,000-6.7%$172/sqft |
Source: | ||
| 11/26/2023 | Listed for sale | $375,000-2.6%$185/sqft |
Source: | ||
| 11/16/2023 | Listing removed | -- |
Source: Owner Report a problem | ||
| 11/11/2023 | Listed for sale | $385,000+42.6%$190/sqft |
Source: Owner Report a problem | ||
| 3/8/2023 | Sold | -- |
Source: Agent Provided Report a problem | ||
| 1/23/2023 | Pending sale | $270,000$133/sqft |
Source: | ||
| 1/8/2023 | Price change | $270,000-3.6%$133/sqft |
Source: | ||
| 10/31/2022 | Price change | $280,000-3.4%$138/sqft |
Source: | ||
| 9/26/2022 | Price change | $290,000-3%$143/sqft |
Source: | ||
| 8/18/2022 | Listed for sale | $299,000$147/sqft |
Source: | ||
| 8/16/2022 | Listing removed | -- |
Source: | ||
| 7/20/2022 | Price change | $299,000-0.2%$147/sqft |
Source: | ||
| 7/1/2022 | Listed for sale | $299,500$147/sqft |
Source: | ||
| 6/28/2022 | Pending sale | $299,500$147/sqft |
Source: | ||
| 5/3/2022 | Price change | $299,500-3.4%$147/sqft |
Source: | ||
| 4/17/2022 | Listed for sale | $310,000$153/sqft |
Source: | ||
| 11/27/2018 | Sold | -- |
Source: Agent Provided Report a problem | ||
Public tax history
| Year | Property taxes | Tax assessment |
|---|---|---|
| 2025 | -- | $337,822 +1.4% |
| 2024 | $6,070 +34.7% | $333,096 +15.6% |
| 2023 | $4,507 -17.9% | $288,027 +10% |
| 2022 | $5,487 -10% | $261,843 +11% |
| 2021 | $6,099 +5.8% | $235,810 +8.1% |
| 2020 | $5,764 +253.9% | $218,127 +13.8% |
| 2018 | $1,629 | $191,604 |
| 2017 | -- | $191,604 |
| 2016 | -- | $191,604 +39.1% |
| 2015 | -- | $137,761 |
| 2014 | -- | $137,761 |
| 2013 | -- | $137,761 -9.2% |
| 2012 | -- | $151,773 +2% |
| 2011 | -- | $148,832 +0% |
| 2010 | -- | $148,831 +12.2% |
| 2009 | -- | $132,613 |
| 2008 | -- | $132,613 +6.2% |
| 2007 | -- | $124,817 |
Find assessor info on the county website
Monthly payment
Est. payment$--/mo
Payment breakdown
Explore the cost of this home by adjusting the details. Changes won't be saved.All calculations are estimates and provided by Zillow, Inc. for informational purposes only. Actual amounts may vary.
HOA fees may include property taxes on listings classified as Co-Ops. Contact the listing agent and/or owner for fee details.
Mortgage interest rates are dependent on a number of factors, including credit score, down payment, and repayment length. Interest rate data provided by Zillow Group Marketplace, Inc. as of 1/1/1970 from various mortgage lenders with which we have lead or other similar arrangements; the Estimated Payment is an average of those rates.
See how much you could borrow to make a competitive offer.
Climate risks
Neighborhood: Westwood Shores
Nearby schools
GreatSchools rating
- 2/10Lansberry Elementary SchoolGrades: PK-5Distance: 3.1 mi
- 3/10Trinity Junior High SchoolGrades: 6-8Distance: 2 mi
- 3/10Trinity High SchoolGrades: 9-12Distance: 2 mi
Schools provided by the listing agent
- Elementary: Lansberry Elementary School
- Middle: Trinity Junior High School
- High: Trinity High School
Source: HAR. This data may not be complete. We recommend contacting the local school district to confirm school assignments for this home.
A local agent can set up tours, give advice and negotiate with sellers.

- Texas
- Trinity County
- Trinity
- 75862
- Westwood Shores
- 17 Cottonwood Rd
Nearby cities
Nearby neighborhoods
Nearby zip codes
Other Trinity Topics
