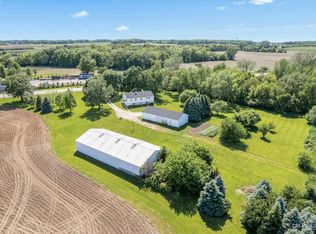
218.20 acres, m/l, located approximately 5 miles northeast of Sycamore, Illinois on the north side of Buzzell Rd. This level to moderately sloping farm has an estimated 216.08 FSA/Eff. crop acres with a PI of 133.50. Buildings on the property include: • 50’ x 96’ pole frame machine shed • Old wooden shed • 27’ diameter grain bin • Old grain bin foundation The outbuildings and grain bin are accessed by a township road. Contact agent for details. This is an attractive farm in a scenic location near Sycamore, Illinois.
Active
$3,382,100
17677 Buzzell Rd, Sycamore, IL 60178
--beds
--baths
--sqft
Farm
Built in ----
218.2 Acres Lot
$-- Zestimate®
$--/sqft
$-- HOA
What's special
- 2 days
- 64
- 4
Zillow last checked:
Listing updated:
Listed by:
Doug Hensley 309-338-7174,
Hertz Real Estate Services
Source: NoCoast MLS as distributed by MLS GRID,MLS#: 6344509
Facts & features
Interior
Features
- Has fireplace: No
Video & virtual tour
Property
Lot
- Size: 218.2 Acres
- Topography: Level,Sloped
Details
- Parcel number: 0601300004
- Zoning: Agriculture
Construction
Type & style
- Home type: SingleFamily
- Architectural style: Other
- Property subtype: Farm
Community & HOA
HOA
- Has HOA: No
Location
- Region: Sycamore
Financial & listing details
- Tax assessed value: $83,483
- Annual tax amount: $12,132
- Date on market: 11/12/2026
- Cumulative days on market: 2 days
Estimated market value
Not available
Estimated sales range
Not available
Not available
Price history
| Date | Event | Price |
|---|---|---|
| 11/12/2026 | Listed for sale | $3,382,100+2185.2% |
Source:  NoCoast MLS as distributed by MLS GRID #6344509 Report a problem | ||
| 7/23/2002 | Sold | $148,000 |
Source: Agent Provided Report a problem | ||
Public tax history
| Year | Property taxes | Tax assessment |
|---|---|---|
| 2025 | $5,765 +2.3% | $83,483 +6.4% |
| 2024 | $5,634 +2.3% | $78,491 +9.5% |
| 2023 | $5,507 +5.8% | $71,675 +9% |
| 2022 | $5,206 +4% | $65,738 +6.5% |
| 2021 | $5,004 +1.9% | $61,714 +2.5% |
| 2020 | $4,909 +2.2% | $60,197 +2.2% |
| 2019 | $4,805 +1.6% | $58,878 +3.1% |
| 2018 | $4,728 +2.6% | $57,091 +4.1% |
| 2017 | $4,610 +4.6% | $54,832 +4.8% |
| 2016 | $4,408 | $52,330 +6.2% |
| 2015 | -- | $49,252 +5.3% |
| 2014 | -- | $46,768 -1.9% |
| 2013 | -- | $47,664 -5.8% |
| 2012 | -- | $50,604 -9.3% |
| 2011 | -- | $55,799 -5% |
| 2010 | -- | $58,761 -4.8% |
| 2009 | -- | $61,743 +3.9% |
| 2008 | -- | $59,448 +4.9% |
| 2007 | -- | $56,682 +7.7% |
| 2006 | -- | $52,624 |
Find assessor info on the county website
Monthly payment
Est. payment
Payment breakdown
Explore the cost of this home by adjusting the details. Changes won't be saved.Climate risks
Neighborhood: 60178
Similar homes
- $3,400,0003 bd2 ba2.4k sqft43W916 Us Highway 20, Hampshire, IL 60140Active
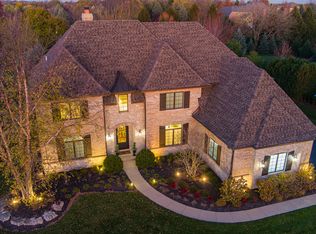
 MLS ID #12780857, Robert Wisdom, RE/MAX Horizon. MRED as distributed by MLS GRID
- $2,650,0006 bd7 ba7.4k sqft36W617 Crane Rd, Saint Charles, IL 60175New
 MLS ID #12805111, Meg Whitted, Baird & Warner Fox Valley-Geneva. MRED as distributed by MLS GRID
- $2,850,0005 bd6 ba9.4k sqft39W220 Longmeadow Ln, Saint Charles, IL 60175New
 MLS ID #12805793, Matthew Kombrink, GRI,SFR, One Source Realty. MRED as distributed by MLS GRID
- $2,300,0004 bd5 ba7.4k sqft39W192 Longmeadow Ln, Saint Charles, IL 60175New
 MLS ID #12805577, Kari Kohler, Coldwell Banker Realty. MRED as distributed by MLS GRID
